Download
1 / 1
10 likes | 101 Vues
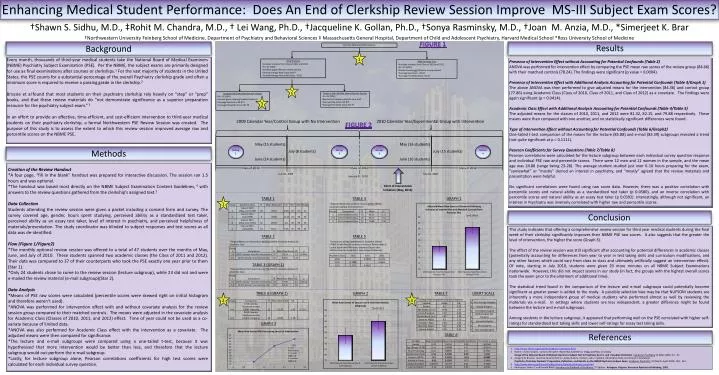
Enhancing Medical Student Performance: Does An End of Clerkship Review Session Improve MS-III Subject Exam Scores?. †Shawn S. Sidhu , M.D., ‡ Rohit M. Chandra, M.D., † Lei Wang, Ph.D., †Jacqueline K. Gollan , Ph.D., †Sonya Rasminsky , M.D., †Joan M. Anzia , M.D., * Simerjeet K. Brar.

E N D
Enhancing Medical Student Performance: Does An End of Clerkship Review Session Improve MS-III Subject Exam Scores? †Shawn S. Sidhu, M.D., ‡Rohit M. Chandra, M.D., † Lei Wang, Ph.D., †Jacqueline K. Gollan, Ph.D., †Sonya Rasminsky, M.D., †Joan M. Anzia, M.D., *Simerjeet K. Brar †Northwestern University Feinberg School of Medicine, Department of Psychiatry and Behavioral Sciences ‡ Massachusetts General Hospital, Department of Child and Adolescent Psychiatry, Harvard Medical School *Ross University School of Medicine FIGURE 1 Results Background 84 Total 2009 and 2010 Students 1 Every month, thousands of third-year medical students take the National Board of Medical Examiners (NBME) Psychiatry Subject Examination (PSE). Per the NBME, the subject exams are primarily designed for use as final examinations after courses or clerkships.1 For the vast majority of students in the United States, the PSE counts for a substantial percentage of the overall Psychiatry clerkship grade and often a minimum score is required to receive a passing grade in the clerkship.2 Briscoe et alfound that most students on their psychiatry clerkship rely heavily on “step” or “prep” books, and that these review materials do “not demonstrate significance as a superior preparation resource for the psychiatry subject exam.” 3 In an effort to provide an effective, time-efficient, and cost-efficient intervention to third-year medical students on their psychiatry clerkship, a formal Northwestern PSE Review Session was created. The purpose of this study is to assess the extent to which this review session improved average raw and percentile scores on the NBME PSE. Presence of Intervention Effect without Accounting for Potential Confounds (Table 2) ANOVA was performed for intervention effect by comparing the PSE mean raw scores of the review group (84.66) with their matched controls (78.24). The findings were significant (p value = 0.0004). Presence of Intervention Effect with Additional Analysis Accounting for Potential Confounds (Table 3/Graph 1) The above ANOVA was then performed to give adjusted means for the intervention (84.36) and control group (77.86) using Academic Class (Class of 2010, Class of 2011, and Class of 2012) as a covariate. The findings were again significant (p = 0.0414). Academic Class Effect with Additional Analysis Accounting for Potential Confounds (Table 4/Table 5) The adjusted means for the classes of 2010, 2011, and 2012 were 81.32, 82.15, and 79.88 respectively. These means were then compared with one another, and no statistically significant differences were found. Type of Intervention Effect without Accounting for Potential Confounds (Table 6/Graph2) One-tailed t-test comparison of the means for the lecture (85.88) and e-mail (83.39) subgroups revealed a trend (not quite significant at p = 0.1111). Pearson Coefficients for Survey Questions (Table 7/Table 8) Pearson correlations were calculated for the lecture subgroup between each individual survey question response and individual PSE raw and percentile scores. There were 12 men and 12 women in the sample, and the mean age was 24.88 (range being 23-28). The average student studied just over 6-10 hours preparing for the exam, “somewhat” or “mostly” denied an interest in psychiatry, and “mostly” agreed that the review materials and presentation were helpful. No significant correlations were found using raw score data. However, there was a positive correlation with percentile scores and natural ability as a standardized test taker (p 0.0580), and an inverse correlation with percentile scores and natural ability as an essay test taker (p 0.0392). Interestingly, although not significant, an interest in Psychiatry was inversely correlated with higher raw and percentile scores. • 2010 Students • Includes students from Class of 2011 and 2012 • N = 47 (56%) • Students were offered a review session • Overall Average Raw Score: 84.67 • Overall Average Percentile Score: 78.55 • 2009 Calendar Year • Includes students from Class of 2010 and 2011 • N = 37 (44%) • Students were not offered a review session • Average Raw Score : 78.24 • Average Percentile Score: 55.32 2 • Students Who Did Not Attend Review Session • N = 24 (29%) • Received all review materials via e-mail • Average Raw Score: 85.875 • Average Percentile Score: 80.79 • Students Who Attended Review Session • N = 24 (29%) • Lecture given covering handout material • Average Raw Score: 85.875 • Average Percentile Score: 80.79 3 2009 Calendar Year/Control Group with No Intervention 2010 Calendar Year/Experimental Group with Intervention FIGURE 2 May (15 students) June (14 students) May (16 students) June (16 students) July (8 students) July (15 students) Group 1 Group 2 Group 3 Group 4 Methods Class of 2010 Class of 2011 Class of 2012 Creation of the Review Handout *A four page, “fill in the blank” handout was prepared for interactive discussion. The session ran 1.5 hours and was optional. *The handout was based most directly on the NBME Subject Examination Content Guidelines, 4 with answers to the review questions gathered from the clerkship’s assigned text.5 Data Collection Students attending the review session were given a packet including a consent form and survey. The survey covered age, gender, hours spent studying, perceived ability as a standardized test taker, perceived ability as an essay test taker, level of interest in psychiatry, and perceived helpfulness of materials/presentation. The study coordinator was blinded to subject responses and test scores as all data was de-identified. Flow (Figure 1/Figure2) *The monthly optional review session was offered to a total of 47 students over the months of May, June, and July of 2010. These students spanned two academic classes (the Class of 2011 and 2012). Their data was compared to 37 of their counterparts who took the PSE exactly one year prior to them (Star 1). *Only 24 students chose to come to the review session (lecture subgroup), while 23 did not and were e-mailed the review material (e-mail subgroup)(Star 2). Data Analysis *Means of PSE raw scores were calculated (percentile scores were skewed right on initial histogram and therefore weren’t used). *ANOVA was performed for intervention effect with and without covariate analysis for the review session group compared to their matched controls. The means were adjusted in the covariate analysis for Academic Class (Classes of 2010, 2011, and 2012) effect. Time of year could not be used as a co-variate because of limited data. *ANOVA was also performed for Academic Class effect with the intervention as a covariate. The adjusted means were then compared for significance. *The lecture and e-mail subgroups were compared using a one-tailed t-test, because it was hypothesized that more intervention would be better than less, and therefore that the lecture subgroup would out-perform the e-mail subgroup. *Lastly, for lecture subgroup alone, Pearson correlations coefficients for high test scores were calculated for each individual survey question. July 01, 2009 July 01, 2010 January 01, 2010 Point of Intervention Initiation (May, 2010) TABLE 1 TABLE 4 GRAPH 1 1 *Adjusted Means for Academic Classes AFTER ANOVA Covariate Analysis for Intervention *p=0.0414 Conclusion This study indicates that offering a comprehensive review session for third year medical students during the final week of their clerkship significantly improves their NBME PSE raw scores. It also suggests that the greater the level of intervention, the higher the score (Graph 3). The effect of the review session was still significant after accounting for potential differences in academic classes (potentially accounting for differences from year to year in test taking skills and curriculum modifications, and any other factors which could vary from class to class and ultimately artificially suggest an intervention effect). Of note, starting in July 2010, students were given 20 more minutes on all NBME Subject Examinations nationwide. However, this did not impact scores in our study (in fact, the groups with the highest overall scores took the exam prior to the allotment of additional time). The statistical trend found in the comparison of the lecture and e-mail subgroups could potentially become significant as greater power is added to the study. A possible selection bias may be that NUFSOM students are inherently a more independent group of medical students who performed almost as well by reviewing the materials via e-mail. In settings where students are less independent, a greater difference might be found between the lecture and e-mail subgroups. Among students in the lecture subgroup, it appeared that performing well on the PSE correlated with higher self-ratings for standardized test taking skills and lower self-ratings for essay test taking skills. TABLE 2 TABLE 5 *Original Means for Intervention BEFORE ANOVA Covariate Analysis for Academic Class *Comparison of Adjusted Means for Academic Classes (TABLE 4) with Results Listed as p-values to Demonstrate a Lack of Significant Differences between Classes after ANOVA Covariate Analysis for Intervention Performed TABLE 3 (GRAPH 1) *Adjusted Means for Intervention AFTER ANOVA Covariate Analysis for Academic Class TABLE 6 (GRAPH 2) GRAPH 2 TABLE 7 LIKERT SCALE 2 3 *Survey Only Completed by Lecture Subgroup *p=0.1111 GRAPH 3 References TABLE 8 KEY 1 = No Intervention 2 = E-mail Subgroup 3 = Lecture Subgroup • http://www.nbme.org/students/SubExam/subexams.html • Ruth E. Levine, David L. Carlson, Renate H. Rosenthal, Kathleen A. Clegg, and Ross D. Crosby. • Usage of the National Board of Medical Examiners Subject Test in Psychiatry by U.S. and Canadian Clerkships. Academic Psychiatry 29 (Mar 2005): 52 - 57. • Gregory W. Briscoe, Lisa Fore-Arcand, Ruth E. Levine, David L. Carlson, John J. Spollen, Christopher Pelic, and Cheryl S. Al-Mateen.Psychiatry Clerkship Students’ Preparation, Reflection, and Results on the NBME Psychiatry Subject Exam. Academic Psychiatry 33 (March-April 2009): 120 - 124. • http://www.nbme.org/Schools/SubjectExams/Subjects/clinicalsci_psy.html • 5. Andreasen, Nancy C and Donald Black. Introductory Textbook of Psychiatry. 3rdEdition. Arlington, Virginia: American Psychiatry Publishing, 2001.