Download
1 / 21
210 likes | 358 Vues
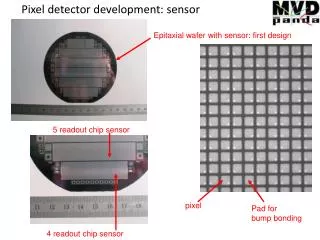
STAR Pixel Detector Phase-1 testing. Testing interrupted. Lena Weronika Szelezniak born on May 30, 2009 at 10:04 am weighing 3.23 kg measuring 50 cm proud parents Joanna & Michal. 2. 2. Talk Outline. Testing plan. Test structures and DAC linearity.

E N D
Testing interrupted Lena Weronika Szelezniak born on May 30, 2009 at 10:04 am weighing 3.23 kg measuring 50 cm proud parents Joanna & Michal LBNL-IPHC 06/2009 - LG 2 2
Talk Outline • Testing plan. • Test structures and DAC linearity. • Measuring discriminator transfer functions. • Effect of bias settings on discriminator transfer functions. • Analog output measurements. • Analog output threshold vs. internal discriminator threshold. • Observations and discussion. LBNL-IPHC 06/2009 - LG 3
Testing plan We generated testing plans significantly in advance of receiving the sensors. The initial testing and implementation plans for testing with the new RDO hardware are linked below. The testing of the Phase-1 sensors is also the testing of the new RDO system which is all new hardware, firmware and software. We anticipated that we would need some time to get all of the RDO system working reliably to adequately test the Phase-1 sensors. We have concentrated on assembling a scripted testing system that will allow for automated testing of sensors. Our testing of Phase-1 is not yet complete, we will show the results that we have generated thus far. http://rnc.lbl.gov/hft/hardware/docs/Phase1/m22_phase1_ultimate_sensor_testing.pdf http://rnc.lbl.gov/hft/hardware/docs/Phase1/phase1_testing_plan_2009_01_18.doc LBNL-IPHC 06/2009 - LG 4 4
Testing Plan Goals • Our goals are: • Validate sensor digital control / JTAG function, digital outputs. • Assess the bias settings. • Validate and characterize the analog pixel function. • Validate and characterize the discriminator function. • Make a preliminary assessment of the fabrication yield. • Assess the sensor characteristics of noise, S/N, efficiency, etc. http://rnc.lbl.gov/hft/hardware/docs/Phase1/m22_phase1_ultimate_sensor_testing.pdf http://rnc.lbl.gov/hft/hardware/docs/Phase1/phase1_testing_plan_2009_01_18.doc LBNL-IPHC 06/2009 - LG 5 5
Current Testing Scope We have mounted 5 sensors onto individual test boards and are performing initial tests. D1 D2 E3 E4 F4 6 6 LBNL-IPHC 06/2009 - LG
Test structures and DAC linearity Threshold as a function of DAC value Crossing points: D2=>110 D1=>170 E4=>100 F4=>140 E3=>100 • Measured value = design value = 250 uV / DAC count • Linearity is good • Some dispersion is observed in the 5 sensors ranging from 100 to 170 DAC counts. • Other DACs show good agreement with design values. LBNL-IPHC 06/2009 - LG 7 7
Discriminator Transfer Functions Digital test results from D1 sensor - internal test mode (pixels disconnected) normalized normalized Nominal bias settings All tests at ~ 36 C LBNL-IPHC 06/2009 - LG 8 8
Discriminator Transfer Functions Digital test results from D1 sensor - pixels connected - dark normalized normalized Nominal bias settings LBNL-IPHC 06/2009 - LG 9 9
Bias Settings D1 E3 F4 parameter scan test results • Comments: • A summary of scans for • Row 1 - ICLPDISC • Row 2 – IBufBias • Row 3 – IPIX that is adjusted together with VREF2 • In all plots, the plot title shows the values used for parameter scan (“_0” is just part of the name) • Colors in plot are in the following order: • Black, red, green, blue, yellow, purple LBNL-IPHC 06/2009 - LG 10 10
Bias Settings D1 E3 F4 ICLPDISC IBufBias IPIX – VREF2 11 11 LBNL-IPHC 06/2009 - LG
Bias Settings • Analysis of discriminator transfer functions: • Calculate derivative of the transfer function • Fit the resulting curve with a Gaussian function • Mean – FPN • Sigma – temporal noise • On the following slide: • Left column shows distribution of means (FPN) • The figure of merit is the RMS of the distribution of means • Right column shows distribution of std (temporal noise) • The figure of merit is the MEAN of the distribution of sigmas 12 12 LBNL-IPHC 06/2009 - LG
Bias Settings F4(nominal: IPIX=50, IBufBias=10, ICLPDISC=100) black plots(optimized: IPIX=60, IBufBias=5, ICLPDISC = 30) red plots 13 13 LBNL-IPHC 06/2009 - LG
Analog Outputs Analog test results from D1 sensor - pixels connected - dark 55Fe spectrum Noise • ENC = ~16 e- LBNL-IPHC 06/2009 - LG 14 14
Analog Outputs Sensor E3 as a function of IPIX bias. Sensor F4 ENC = 14.6 IPIX = 70 15 15 LBNL-IPHC 06/2009 - LG
Analog output threshold vs. internal discriminator threshold (D1) Generating the discriminator transfer functions in analysis from the analog outputs. Arbitrary offset Sensor D1 has 1 bad analog output => 560 columns shown. Width of transfer function in each column => temporal noise LBNL-IPHC 06/2009 - LG 16 16
LED tests Sensor E3 4 consecutive frames with LED pulse (occurring just after frame 1 starts) 17 17 LBNL-IPHC 06/2009 - LG
Observations and Discussion • Yield – All 5 sensors tested have fully functional JTAG and digital interfaces. One sensor has a dead analog output channel. All other analog output channels are functional. This is a small sample – we are loading 5 more test boards with Phase-1 sensors. We will test and report. • Questions: • External voltage reference for comparators – we can not get it to work. This is under investigation with IPHC. Christine has suggested a possible fix. We will test this soon and report. • Internal comparator reference (pixels not connected) – why is there a larger variation in offsets than with pixels connected? • When pixels are connected, are the observed magnitude of the offsets in the discriminator switching voltage what is expected? • The first ~300 columns seem to have difference bias responses than the rest of the sensor, is this expected? • The sensor chip used for the latch-up testing appears to have become non-responsive. We will investigate and report. • What can be done? • Analysis of design in the way voltage references are distributed, or other reason to explain the comparator switching voltage differences. • 1 threshold per output? • Probe test pad for temperature sensor. 18 LBNL-IPHC 06/2009 - LG 18
end LBNL-IPHC 06/2009 - LG 19 19
Test structures and DAC linearity LBNL-IPHC 06/2009 - LG 20 20
Test structures and DAC linearity LBNL-IPHC 06/2009 - LG 21 21