Download

1 / 76
780 likes | 1.17k Vues
Pure Monopoly. Pure Monopoly. Pure Competition. Market Structure Continuum. SLIDES PREPARED BY JUDITH SKUCE, GEORGIAN COLLEGE. In this chapter you will learn. 9.1 The conditions required for pure monopoly to arise 9.2 About the profit-maximizing price and output in pure monopoly

E N D
Pure Monopoly Pure Monopoly Pure Competition Market Structure Continuum SLIDES PREPARED BY JUDITH SKUCE, GEORGIAN COLLEGE Microeconomics, Chapter 9
In this chapter you will learn 9.1 The conditions required for pure monopoly to arise 9.2 About the profit-maximizing price and output in pure monopoly 9.3 About the economic effects of monopoly 9.4 Why a monopolist prefers to charge different prices in different markets 9.5 The choices facing governments that regulate monopolies 9.6 About the deadweight loss associated with monopoly Microeconomics, Chapter 9
Chapter 9 Topics 9.1 Characteristics of Pure Monopoly 9.2 Output & Price Determination in a Monopoly 9.3 Economic Effects of Monopoly 9.4 Price Discrimination & Monopoly 9.5 Regulated Monopoly 9.6 Monopoly & Deadweight Loss Microeconomics, Chapter 9
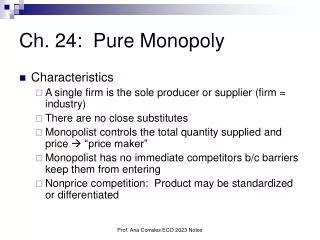
Pure Monopoly Characteristics: • Single seller • No close substitutes • Price-maker • Blocked entry Microeconomics, Chapter 9
Pure Monopoly • Examples • public utilities Microeconomics, Chapter 9
Pure Monopoly • Examples • public utilities • professional sports teams Microeconomics, Chapter 9
Barriers to Entry • Economies of Scale • e.g., natural monopoly illustrated… Microeconomics, Chapter 9
Economies of Scale D Figure 9-1 $20 15 ATC 10 If ATC declines over the entire market demand, least-cost production is realized only if there is one producer - a natural monopoly 0 50 100 200 Quantity (millions) Microeconomics, Chapter 9
Barriers to Entry • Economies of Scale • Legal Barriers to Entry: Patents & Licenses • Ownership or Control of Essential Resources • Pricing & Other Strategic Barriers to Entry Microeconomics, Chapter 9
Monopoly Demand Three basic assumptions: • Monopoly status is secured • Firm is not governmentally regulated • Firm charges the same price for all units Microeconomics, Chapter 9
Monopoly Demand • Marginal revenue is less than price illustrated… Microeconomics, Chapter 9
Table 9-1 Microeconomics, Chapter 9
Table 9-1 Microeconomics, Chapter 9
Table 9-1 ] Microeconomics, Chapter 9
Table 9-1 ] ] Microeconomics, Chapter 9
Table 9-1 ] ] ] Notice that MR < p ] ] ] ] ] ] ] Microeconomics, Chapter 9
132 Gain = $132 Figure 9-2 P When price decreases from $142 to $132, one more unit is sold…. revenue will increase by $132 with the extra unit sold $142 D Q 1 2 3 4 5 6 Microeconomics, Chapter 9
Figure 9-2 P When price decreases from $142 to $132, one more unit is sold…. but revenue loss = $10 X 3 units $142 Loss = $30 132 D Marginal revenue = $132-30 = $102 < $132 (price) Gain = $132 Q 1 2 3 4 5 6 Microeconomics, Chapter 9
Monopoly Demand • Marginal revenue is less than price • The monopolist is a price-maker Microeconomics, Chapter 9
Monopoly Demand • Marginal revenue is less than price • The monopolist is a price-maker • The monopolist sets prices in the elastic region of demand illustrated… Microeconomics, Chapter 9
Figure 9-3 Elastic 200 150 200 50 Dollars Inelastic MR D Q 0 1 2 3 4 5 6 7 8 9 10 11 12 13 14 15 16 17 18 750 500 250 TR Dollars TR Q 0 1 2 3 4 5 6 7 8 9 10 11 12 13 14 15 16 17 18 Microeconomics, Chapter 9
Figure 9-3 Elastic 200 150 200 50 Dollars Inelastic MR D Q 0 1 2 3 4 5 6 7 8 9 10 11 12 13 14 15 16 17 18 750 500 250 TR Dollars TR Q 0 1 2 3 4 5 6 7 8 9 10 11 12 13 14 15 16 17 18 Microeconomics, Chapter 9
Chapter 9 Topics 9.1 Characteristics of Pure Monopoly 9.2 Output & Price Determination in a Monopoly 9.3 Economic Effects of Monopoly 9.4 Price Discrimination & Monopoly 9.5 Regulated Monopoly 9.6 Monopoly & Deadweight Loss Microeconomics, Chapter 9
Output & Price Determination • Cost Data • assume competitive resource markets • MR=MC Rule illustrated… Microeconomics, Chapter 9
Table 9-1 produce? ] ] ] ] ] ] ] ] ] ] ] ] ] ] ] ] ] ] ] ] Microeconomics, Chapter 9
Table 9-1 produce? ] ] ] ] ] ] ] ] ] ] ] ] ] ] ] ] ] ] ] ] Microeconomics, Chapter 9
Table 9-1 produce? ] ] ] ] ] ] ] ] ] ] ] ] ] ] ] ] ] ] ] ] Microeconomics, Chapter 9
Table 9-1 produce? ] ] ] ] ] ] ] ] ] ] ] ] ] ] ] ] ] ] ] ] Microeconomics, Chapter 9
Table 9-1 produce? ] ] ] ] ] ] ] ] ] ] ] ] ] ] ] ] ] ] ] ] Microeconomics, Chapter 9
Table 9-1 produce? ] ] ] ] ] ] ] ] ] ] ] ] ] ] ] ] ] ] ] ] Microeconomics, Chapter 9
Table 9-1 stop here ] ] ] ] ] ] ] ] ] ] ] ] ] ] ] ] ] ] Don’t produce beyond the 5th unit ] ] Microeconomics, Chapter 9
Table 9-1 ] ] ] ] ] ] ] ] ] ] ] ] ] ] ] ] ] ] Same result when we compare TC & TR ] ] Microeconomics, Chapter 9
P 200 175 150 125 100 75 50 25 D MR Q 0 1 2 3 4 5 6 7 8 9 10 Figure 9-4 Microeconomics, Chapter 9
P 200 175 150 125 100 75 50 25 D MR = MC MR Q 0 1 2 3 4 5 6 7 8 9 10 Figure 9-4 find q MC Microeconomics, Chapter 9
P 200 175 150 125 100 75 50 25 D MR Q 0 1 2 3 4 5 6 7 8 9 10 Figure 9-4 find p MC monopolist is “price-maker” $122= p Microeconomics, Chapter 9
P 200 175 150 125 100 75 50 25 D MR Q 0 1 2 3 4 5 6 7 8 9 10 Figure 9-4 find ATC MC $122= p ATC Microeconomics, Chapter 9
P 200 175 150 125 100 75 50 25 D MR Q 0 1 2 3 4 5 6 7 8 9 10 Figure 9-4 MC $122= p ATC $94=ATC Microeconomics, Chapter 9
P 200 175 150 125 100 75 50 25 D MR Q 0 1 2 3 4 5 6 7 8 9 10 Figure 9-4 profit =(p - ATC) X q =(122-94) X 5 =140 MC $122= p ATC Profit $94=ATC Microeconomics, Chapter 9
Output & Price Determination • Cost Data • assume competitive resource markets • MR=MC Rule • No Monopoly Supply Curve illustrated… Microeconomics, Chapter 9
No Monopoly Supply Curve p1 D MR q1 q1 supplied at p1 p MC q Microeconomics, Chapter 9
No Monopoly Supply Curve q1 supplied at p2 under different D conditions p MC p2 p1 D MR q q1 Microeconomics, Chapter 9
No Monopoly Supply Curve p no unique p-q combination NO SUPPLY CURVE MC p2 p1 D MR q q1 Microeconomics, Chapter 9
Output & Price Determination • Misconceptions Concerning Monopoly Pricing • Not the highest price • Total, not unit, profit • Possibility of Losses by Monopolist illustrated… Microeconomics, Chapter 9
Loss MR = MC Figure 9-5 P MC A ATC Pm AVC D V MR Q Qm Microeconomics, Chapter 9
Chapter 9 Topics 9.1 Characteristics of Pure Monopoly 9.2 Output & Price Determination in a Monopoly 9.3 Economic Effects of Monopoly 9.4 Price Discrimination & Monopoly 9.5 Regulated Monopoly 9.6 Monopoly & Deadweight Loss Microeconomics, Chapter 9
Economic Effects of Monopoly • Price, Output & Efficiency • inefficient relative to a purely competitive industry • Pm > MC • Pm > minimum ATC illustrated… Microeconomics, Chapter 9
Pc p=MC=minimum ATC Qc Figure 9-6 P S = MC Price & output if the industry were competitive D Q Microeconomics, Chapter 9
Pm Pc Qm Qc Figure 9-6 P S = MC Monopolist will sell fewer units at a higher price than in pure competition D MR Q Microeconomics, Chapter 9
Economic Effects of Monopoly • Income Transfer • monopoly owners enriched at the expense of consumers Microeconomics, Chapter 9
Economic Effects of Monopoly • Cost Complications • economies of scale • simultaneous consumption • network effects • X-inefficiency illustrated… Microeconomics, Chapter 9