Download
1 / 32
360 likes | 830 Vues
Pure Monopoly. Pure Monopoly. Pure Competition. Monopolistic Competition. Oligopoly. Market Structure Continuum. FOUR MARKET MODELS. Pure Monopoly:. MONOPOLY EXAMPLES. Pure Monopoly Near Monopoly Natural Monopoly Regulated Monopoly. THE NATURAL MONOPOLY CASE. $20. 15. LRATC.

E N D
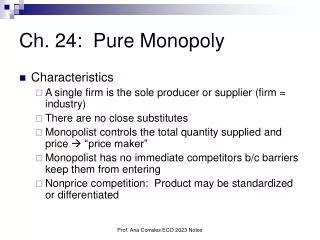
Pure Monopoly Pure Competition Monopolistic Competition Oligopoly Market Structure Continuum FOUR MARKET MODELS Pure Monopoly:
MONOPOLY EXAMPLES • Pure Monopoly • Near Monopoly • Natural Monopoly • Regulated Monopoly
THE NATURAL MONOPOLY CASE $20 15 LRATC Average Total Cost 10 If LRATCdeclines over extended output, least-cost production is realizedonlyif there is one producer - a natural monopoly. 0 50 100 200 Quantity
BARRIERS TO ENTRY • Economies of Scale • Legal Barriers to Entry • Patents • Licenses • Ownership or Control of Essential Resources • Pricing and Other Strategic Barriers to Entry
MONOPOLY • 3 Basic Assumptions: • Monopoly Status is Secure • No Government Regulation • Firm Charges the Same Price for all Units Sold
MONOPOLY REVENUES & COSTS Revenue Data Cost Data Quantity of Output Price (Average Revenue) Average Total Cost Profit + or loss - Total Revenue Marginal Revenue Total Cost Marginal Cost - x 0 $172 $ 0 $100 - $100 = =
] ] MONOPOLY REVENUES & COSTS Revenue Data Cost Data Quantity of Output Price (Average Revenue) Average Total Cost Profit + or loss - Total Revenue Marginal Revenue Total Cost Marginal Cost 0 1 0 $172 $172 162 $ 0 162 $ 0 $100 $100 190 - $100 - $100 - 28 90 $162 - x = = $190.00 MC = $190 – 100 = $90 MR = $162 – 0 = $162 MR > MC Loss Improvement from -$100 to -$28 Check next unit of output!
] ] ] ] ] ] ] ] ] ] ] ] ] ] ] ] ] ] ] ] MONOPOLY REVENUES & COSTS Revenue Data Cost Data Quantity of Output Price (Average Revenue) Average Total Cost Profit + or loss - Total Revenue Marginal Revenue Total Cost Marginal Cost 0 1 2 3 4 5 6 7 8 9 10 $172 162 152 142 132 122 112 102 92 82 72 $ 0 162 304 426 528 610 672 714 736 738 720 $100 190 270 340 400 470 550 640 750 880 1030 - $100 - 28 + 34 + 86 + 128 + 140 + 122 + 74 - 14 - 142 - 310 90 80 70 60 70 80 90 110 130 150 $162 142 122 102 82 62 42 22 2 - 18 $190.00 135.00 113.33 100.00 94.00 91.67 91.43 93.73 97.78 103.00
] ] ] ] ] ] ] ] ] ] ] ] ] ] ] ] ] ] ] ] MONOPOLY REVENUES & COSTS Revenue Data Cost Data Quantity of Output Price (Average Revenue) Average Total Cost Profit + or loss - Total Revenue Marginal Revenue Total Cost Marginal Cost Can you see profit maximization? 0 1 2 3 4 5 6 7 8 9 10 $172 162 152 142 132 122 112 102 92 82 72 $ 0 162 304 426 528 610 672 714 736 738 720 $100 190 270 340 400 470 550 640 750 880 1030 - $100 - 28 + 34 + 86 + 128 + 140 + 122 + 74 - 14 - 142 - 310 MR > = MC 90 80 70 60 70 80 90 110 130 150 $162 142 122 102 82 62 42 22 2 - 18 $190.00 135.00 113.33 100.00 94.00 91.67 91.43 93.73 97.78 103.00
MONOPOLY REVENUES & COSTS $200 150 100 50 Dollars Q 0 1 2 3 4 5 6 7 8 9 10 11 12 13 14 15 16 17 18
MONOPOLY REVENUES & COSTS Elastic $200 150 100 50 Dollars MR DARP Q 0 1 2 3 4 5 6 7 8 9 10 11 12 13 14 15 16 17 18
MONOPOLY REVENUES & COSTS Elastic Inelastic $200 150 100 50 • MR bisects DARP • When MR = 0 Total Revenue is Maximized • When MR is positive D is elastic • When MR is negative D is inelastic Dollars MR DARP Q 0 1 2 3 4 5 6 7 8 9 10 11 12 13 14 15 16 17 18
OUTPUT AND PRICE DETERMINATION • MR = MC Rule • No Monopoly Supply Curve • Market Demand is the Monopoly Demand • Monopoly Misconceptions • Not Highest Price • Possibility of Losses Graphically…
200 175 150 125 100 75 50 25 Price, costs, and revenue Q 0 1 2 3 4 5 6 7 8 9 10 OUTPUT AND PRICE DETERMINATION Profit Maximization Under Monopoly Profit Per Unit MC $122 Profit ATC $94 DARP MR = MC MR
200 175 150 125 100 75 50 25 What About Loss Minimization? Price, costs, and revenue Q 0 1 2 3 4 5 6 7 8 9 10 OUTPUT AND PRICE DETERMINATION Profit Maximization Under Monopoly Profit Per Unit MC $122 Profit ATC $94 DARP MR = MC MR
Since Pm exceeds AVC, the firm will produce 200 175 150 125 100 75 50 25 Price, costs, and revenue Q 0 1 2 3 4 5 6 7 8 9 10 OUTPUT AND PRICE DETERMINATION Loss Minimization Under Monopoly Loss Per Unit MC ATC A Loss AVC Pm V DARP MR = MC MR Qm
200 175 150 125 100 75 50 25 What are the Economic Effects of Monopoly? Price, costs, and revenue Q 0 1 2 3 4 5 6 7 8 9 10 OUTPUT AND PRICE DETERMINATION Loss Minimization Under Monopoly Loss Per Unit MC ATC A Loss AVC Pm V D MR = MC MR Qm
An industry in pure competition sells where supply and demand are equal INEFFICIENCY OF PURE MONOPOLY P S = MC At MR=MC a monopolist will sell less units at a higher price than in competition Pm Pc DARP MR Q Qm Qc
INEFFICIENCY OF PURE MONOPOLY P S = MC At MR=MC A monopolist will sell less units at a higher price than in competition Monopoly pricing effectively creates a welfare transfer from buyers to the seller! Pm Pc DARP MR Q Qm Qc
COST COMPLICATIONS Economies of Scale • Simultaneous consumption • Network effects Diseconomies of Scale • X-Inefficiency • Rent-Seeking Behavior • Technological Advance
PRICE DISCRIMINATION Conditions • Monopoly Power • Market Segregation • No Resale Consequences • More Profit • More Production Graphically…
PRICE DISCRIMINATION MC Economic profits with a single MR=MC price P ATC Price and Costs DARP MR Q Q1
PRICE DISCRIMINATION A perfectly discriminating monopolist has MR=D, producing more product and more profit! MC P ATC Price and Costs MR=D DARP Q Q1 Q2
PRICE DISCRIMINATION MC Economic profits with price discrimination P ATC Price and Costs MR=D DARP Q Q1 Q2
Monopoly Assessment& Policy Options • Antitrust Action • Sherman Act • Clayton Act • Ignore it, if it is short lived • Regulate Natural Monopolies
REGULATED MONOPOLY Natural Monopolies • Socially Optimum Price • P = MC • Fair-Return Price • P = ATC Graphically…
REGULATED MONOPOLY Monopoly Price MR = MC P Pm Price and Costs ATC MC DARP MR Q Qm
REGULATED MONOPOLY P Fair-Return Price Normal Profit Only Price and Costs ATC Pf MC DARP MR Q Qf
REGULATED MONOPOLY P Socially-Optimum Price P = MC Price and Costs ATC MC Pr DARP MR Q Qr
REGULATED MONOPOLY Dilemma of Regulation Which Price? P MR = MC Fair-Return Price Pm Socially-Optimum Price Price and Costs ATC Pf MC Pr DARP MR Q Qm Qf Qr