Download
1 / 14
140 likes | 363 Vues
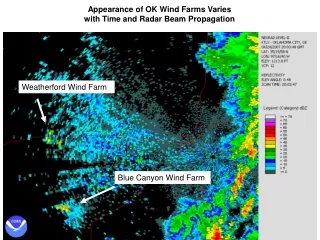
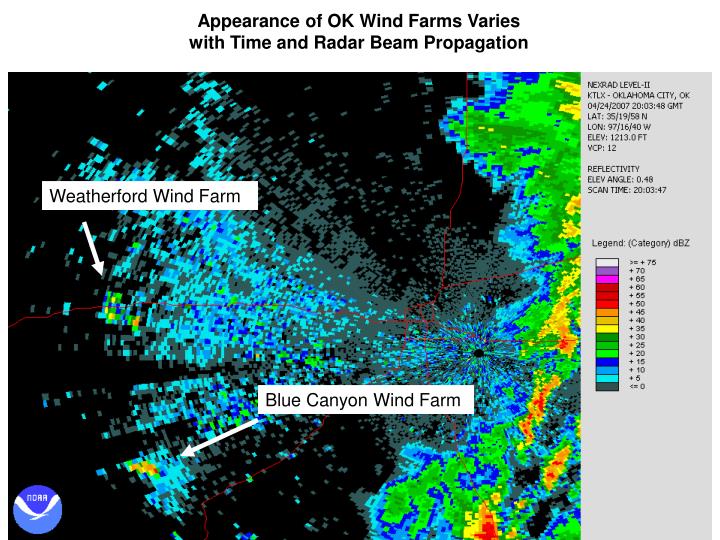
Appearance of OK Wind Farms Varies with Time and Radar Beam Propagation. Weatherford Wind Farm. Blue Canyon Wind Farm. Blue Canyon Wind Farm Appearance Varies With Beam Propagation. Spurious Echo Return from McLean County, IL Wind Farm.

E N D
Appearance of OK Wind Farms Varies with Time and Radar Beam Propagation Weatherford Wind Farm Blue Canyon Wind Farm
Blue Canyon Wind Farm Appearance Varies With Beam Propagation
False Precipitation Estimates Resulting from Wind Farm (McLean Co, IL)
Radar Reflectivity Product from Ft Drum, NY Wind Farm False echoes from the wind farm are evident; note weather coming from the West. Operators looking at any single image in the loop, would see what appears to be thunderstorms, in the area occupied by the wind farm. See following slide.
Close up of Ft Drum, NY wind farm; Note strong echoes along the leading edge as well as weak return behind the turbines, due to “multi-path scattering” of radar beam. Weather is approaching from the West. Wind Turbines on Ridge Spurious Multi-path scatter region RADAR Wind Turbines on Ridge
Majority of Turbines This velocity image matches the previous reflectivity product. The picture has been zoomed to show only that area associated with echoes caused by the wind towers/turbines. The echoes downrange from the wind towers/turbines are spurious as shown on the previous slide. Red colors indicate outbound velocities (going away from the radar) and green colors indicate inbound velocities (coming toward the radar). Red colors in close proximity to green colors can be indicators of tornadoes, mesocyclones, convergence or divergence, all of which can be indicators of severe weather.
When wind turbines are placed within 2-3 miles as they are to the north-east-southeast of this site, even the data from higher elevations are affected. This reflectivity product shows the echoes generated by the towers/turbines on the second elevation (nominal 1.5 degrees). The corresponding velocity image follows.
Wind Turbine Return Clear Air Return Velocity image from the second elevation scan. This second tilt is contaminated by spurious echoes, and mix with environmental wind data.
Impact of Carroll County, Iowa wind farms on WSR-88D Evening of 18 July 2007 Karl Jungbluth, SOO DMX
0236 UTC Reflectivity 2007 July 19 • Are returns from Wind Farms or real storms??? • Emergency manager mentioned some confusion as storms moved in. • Question sent to webmaster from a user who had trouble differentiating between storms and false echoes.
0236 UTC Reflectivity 2007 July 19 • Are returns from Wind Farms or real storms??? • Emergency manager mentioned some confusion as storm moved in. • Question sent to webmaster from a user who had trouble differentiating between storms and false echoes. Storms Wind Farms
0512 UTC Storm Total Precipitation 19 July 2007Erroneous 5”+ estimates due to wind farms