Download
1 / 71
771 likes | 943 Vues
CE3503 Environmental Engineering. Wastewater Treatment. Dr. Martin T. Auer MTU Department of Civil & Environmental Engineering. The Clean Water Act. ‘fishable-swimmable’. yes. Technology-Based Standards. no. yes. Water Quality-Based Standards. T otal M aximum D aily L oads.

E N D
CE3503 Environmental Engineering Wastewater Treatment Dr. Martin T. Auer MTU Department of Civil & Environmental Engineering
The Clean Water Act ‘fishable-swimmable’ yes Technology-Based Standards no yes Water Quality-Based Standards Total Maximum Daily Loads Discharge Permits (NPDES) POTW Design
Federal Water Pollution Control Act Amendments of 1972 (The Clean Water Act) • Technology-based effluent limits • Water quality-based effluent limits • Total Maximum Daily Loads (TMDLs) • National Pollutant Discharge Elimination System (NPDES) Add Clark In A Watershed – Everyone Lives Downstream
Receiving Water Impacts River DO Model Q = 8 C = 0, 250, 100
Michigan NPDES Permit
Treatment Plant Design Design Model Cin = 250 k = 0.1 V = 0, 250, 750
Federally-Regulated Non-Domestic Sources Aluminum Forming Battery Manufacturing; Cement Manufacturing; Coil Coating & Can Making; Copper Forming; Dairy Products Processing; Electrical & Electronic Component Manufacturing; Electroplating & Metal Finishing; Explosives Manufacturing; Fruit & Vegetable Processing; Ferroalloy Manufacturing; Fertilizer Manufacturing; Glass Manufacturing; Gum & Wood Chemicals Manufacturing; Ink Formulating; Inorganic Chemical Manufacturing; Iron & Steel Manufacturing; Leather Tanning & Finishing; Meat Products Processing; Metal Molding & Casting; Mining Operations; Nonferrous Metals Processing; Organic Chemicals, Plastic & Synthetic Fibers Manufacturing; Paving & Roofing Materials Manufacturing; Soap & Detergent Manufacturing; Petroleum Refining; Pesticide Manufacturing; Porcelain Enameling; Pharmaceutical Manufacturing; Plastic Molding & Forming; Pulp, Paper and Paperboard Manufacturing Timber Products Processing; Textile Mills http://www.socwa.com/indwaste.htm
Chemicals Designated as Priority Pollutants (126) • AROCLOR 1254 (industrial product; banned) • BENZENE (industrial product) • BENZO(A)PYRENE (asphalt roofing manufacture) • CADMIUM (heavy metal; electric/gas industries) • CHLORDANE (pesticide; banned or restricted) • CHROMIUM (heavy metal; widely used in industry) • DDT (pesticide; banned or restricted) • ENDRIN (pesticide; banned or restricted) • MERCURY (heavy metal; electric/gas and chemical industries) • PENTACHLOROPHENOL (industrial chemical – wood products) • TOLUENE (widely used industrial chemical) • TRICHLOROETHYLENE (industrial solvent, degreaser) http://www.scorecard.org/chemical-groups/one-list.tcl?short_list_name=pp
What’s in wastewater? Waste • human feces and urine • food from sinks • soaps and other cleaning agents • runoff from streets and lawns • industrial discharges
What’s in wastewater? Water • lots of it! • Urinal - 1 gallon per flush • Toilet - 4 gallons per flush • Shower - 20 gallons per use • Overall - 55 gal/person/day
It’s mostly water! There are about 500 parts of waste in every 1 million parts of wastewater; that’s 500 ppm. H2O It’s like trying to find this class at a sold out Packers game!
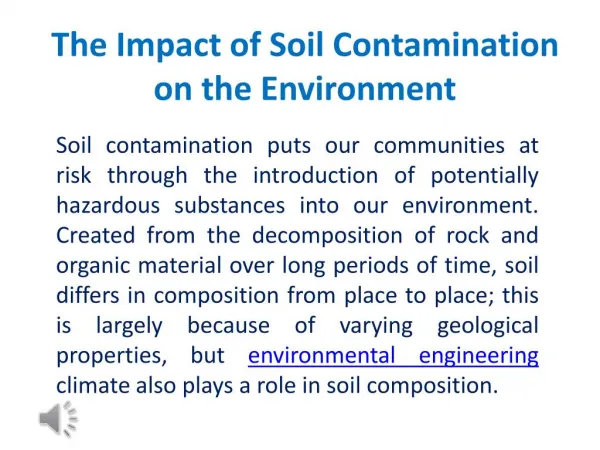
So what’s the problem? P SNOT: it’s not a pretty picture!
Composition of Domestic Wastewater ConstituentInfluentEffluent Suspended Solids 200-300 30 BOD5 200-400 30 Ammonia Nitrogen 20-40 1-2 Phosphorus 7-10 1 Fecal Coliforms 104-106 200 All concentrations are mg/L, except fecal coliforms which are colony forming units (cfu) per 100 mL.
This is really not something I’ve given a lot of thought to. Where does it go when you flush the toilet?
P Hancock P Houghton G Franklin Sq. Surface; 30” G Super 8 Near Surface; 30” G MTU 10’;36” G M&M Bldg. Lake; 48” POTW 20’; 48” P Portage Lake Sewer System
Diurnal Variation in Wastewater Flow Metcalf & Eddy
Wet-Dry Variation in Wastewater Flow Metcalf & Eddy
Preliminary Treatment Overview (plant protection) from pumps or wet well Bar Rack or Screen or Comminutor Grit Chamber Flow Equalization to primary treatment
Preliminary Treatment: C Comminutor
Preliminary Treatment: Flow Equalization The Henry Fork Wastewater Treatment Facility, Hickory, NC http://www.hickorync.gov/egov/docs/1222790452442.htm
Preliminary Treatment Overview (plant protection) from pumps or wet well Bar Rack or Screen or Comminutor Grit Chamber Flow Equalization to primary treatment
Primary Treatment (solids, sedimentation) (Kiely, 1997)
Primary Treatment – Design The critical particle is defined as that particle will be captured prior to exiting the sedimentation tank. This particle, and all particles which settle more rapidly, will be retained. In Out vp The critical settling velocity, vc, is that of the critical particle.
Primary Treatment – Design The design parameter for primary treatment is the surface overflow rate, In Out which can be shown to be equivalent to the critical settling velocity,
Primary Treatment – Design In Out vp2 Vc, SOR vp1 The steeper the slope, the higher the settling velocity The design objective then is to reduce vc (SOR) in order to capture the target particle.
Primary Treatment – Design In Out vp2 The steeper the slope, the higher the settling velocity vp1 vc This is accomplished by manipulating the tank residence time () by changing the surface area (A),
Primary Treatment – Design (Kiely, 1997)
Secondary Treatment (biological) Simple carbohydrates (a form of organic matter) are produced by plants through the process of photosynthesis. These are then converted to more complex carbohydrates and other forms of organic matter such as starches, fats and proteins. The sun’s energy, captured during photosynthesis, is stored in the chemical bonds of this organic matter. Organisms (from bacteria to humans) take up and metabolize organic matter to obtain the energy required to support life. In secondary or biological treatment, we utilize microorganisms to remove the dissolved and small particulate organic matter which would exert an oxygen demand if it were released to the environment. The waste (actually organic matter) is simply converted into another form (microorganisms) which can then be separated from the waste stream by settling yielding a clean effluent.
Microorganisms in Secondary or Biological Treatment Source: http://www.college.ucla.edu/webproject/micro7/studentprojects7/Rader/asludge2.htm
Secondary Treatment: Trickling Filter Media Image Source: Wastewater Engineering, Metcalf & Eddy
Secondary Treatment: Trickling Filter Design Hydraulic Load (Wh) 4-10 m3m-2d-1 Organic Load 240-480 gBODm3d-1
Activated Sludge Design: microorganism growth rate In the aeration tank, microorganisms take up food (soluble and particulate BOD) and grow, converting waste to microorganisms. Since the concentration of microorganisms in the aeration take is held constant, the ‘growth’ must be removed or wasted. The rate of sludge wasting (dX/dt) divided by the mass of sludge in the aeration tank is equal to the microorganism growth rate,
Activated Sludge Design: relation to BOD concentration Growth Rate () As the steady state food concentration in the aeration tank increases, the growth rate increases. Food (BOD)
Activated Sludge Design: growth phases High Low High BOD Poor settling Low BOD Good settling
Activated Sludge Design: solids retention time The solids retention time (SRT) or sludge age is defined as the average time that a microorganism spends in the aeration tank and is equal to the inverse of the growth rate, Thus, the longer the SRT, the lower the growth rate, the lower the effluent BOD and the better the settling characteristics of the sludge. The design should seek to operate toward the upper end of the range of SRT values (2-20 days) to achieve the best removal.
Activated Sludge Design: food:microorganism ratio The solids retention time or sludge age varies with the rate at which the microorganisms are fed, i.e. the food:microorganism ratio, Low F/M ratios equate to high SRTs and generate the desired effluent characteristics (low BOD, good settling). Since S0 and Q0 are fixed and X must be maintained between some bounds, the design parameter becomes V, the volume of the aeration tank. Note, however, that there are practical limits on the volume of the aeration tank, requiring consideration of less ‘optimal’ treatment.
(From Kiely, 1997) Log Growth Endogenous Growth Declining Growth Activated Sludge: design and operation Operation Design