Download
1 / 19
200 likes | 343 Vues
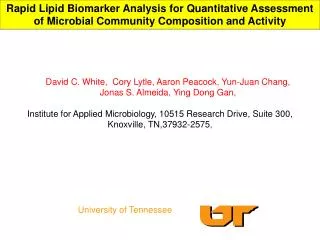
Changes in soil viable microbial biomass and composition reflect disturbance impacts and may serve as quantitative end points for reversibility. David C. White 1 , Aaron Peacock 1 , Sareh. J. Macnaughton 2 , James M. Cantu 1 , Virginia H. Dale 3 ,.

E N D
Changes in soil viable microbial biomass and composition reflect disturbance impacts and may serve as quantitative end points for reversibility • David C. White1, Aaron Peacock1, • Sareh. J. Macnaughton2, James M. Cantu1, Virginia H. Dale3, 1.Center for Biomarker Analysis, University of Tennessee, Knoxville, TN 37932, 2AEA Technology Environment, Harwell, Oxon, UK. 3Environmental Sciences Division Oak Ridge National Laboratory, Oak Ridge, TN. CBA
Changes in soil viable microbial biomass and composition reflect disturbance impacts and may serve as quantitative end points for reversibility • Microbial community provides multi-species multi-trophic level is analysis >>> single species for Quantitative Toxicity Assessment • Surface WaterPollution Impact quantitatively reflected in the viable biomass and community composition of the periphyrton microbiota* • Parallels Cerodaphnia and Pimephales promelas In acute & chronic tests • a) Most sensitive indicator is the increase in filamentous green algae and decrease in diatoms with increasing pollution • Reflected in the phospholipid fatty acid analysis (PLFA) • Green algae 18:19c, 16:43, 18:26, 16:113t with toxicity • Diatoms 22:66, 20:53*, 14:0, 18:26 with toxicity. • b). PHA/PLFA & TG/PLFA [Storage/membrane lipid] with increasing toxic exposure • Not need qualified personnel and tedious microscopic counts • *Guckert, J. B., S. C. Nold, H. L. Boston, and D. C. White. 1992. Periphyton response along an industrial effluent gradient: Lipid-based physiological stress analysis and pattern recognition of microbial community structure. Canad. J. Fish. Aquat Sci. 49: 2579-2587.
Changes in soil viable microbial biomass and composition reflect disturbance impacts and may serve as quantitative end points for reversibility Microbial community provides multi-species multi-trophic level is analysis >>> single species for Quantitative Toxicity Assessment (3 dates) . Most Impacted Least Impacted 22:66 20:53* 14:0 18:26 Diatoms 18:19c, 16:43, 18:26, 16:113t Green Filamentous Algae Intermediate Impacted
Pollution Impacts in Soils Petroleum Bioremediation of soils at Kwajalein Nutrient Amendment and Ex Situ Composting vs Control Showed: 1. VIABLE BIOMASS (PLFA) 2. SHIFT PROPORTIONS: Gram + , Gram - (Terminal branched PLFA, :: Monoenoic, normal PLFA ) 3. Cyclo17:0/16:17c :: Cyclo19:0/18:17c (Stress) 4. = 16:17t/16:7c (Toxicity), [often ] 5. 16:19c/16:17c (Decreased Aerobic Desaturase) 6. % 10Me16:0 & Br17:1 PLFA (Sulfate-reducing bacteria) 7. % 10Me18:0(Actinomycetes) 8. =PROTOZOA, FUNGI+ (Polyenoic PLFA) [ often ] In other studies also usually see: 1. PHA/PLFA (Decreased Unbalanced Growth) 2. RATIO BENZOQUINONE/NAPHTHOQUINONE (Increased Aerobic Metabolism) DEGREE OF SHIFT IN SIGNATURE LIPID BIOMARKERS PROPORTIONAL TO DEGRADATION
Changes in soil viable microbial biomass and composition reflect disturbance impacts and may serve as quantitative end points for reversibility Microbial community provides multi-species multi-trophic level is analysis >>> single species for Quantitative Toxicity Assessment 2. Exposure to petroleum hydrocarbons acute & chronic tests Shifts showed reversibility with time and distance plume had migrated biomass, Gram- negatives, UQ/MK, Gram- positive, branched PLFA, PHA/PLFA *Stephen, J. R., Y-J. Chang, Y. D. Gan, A. Peacock, S. M. Pfiffner, M. J. Barcelona, S. M. D. C. White, and S. J. Macnaughton. 1999. Microbial Characterization of JP-4 fuel contaminated-site using a combined lipid biomarker/PCR-DGGE based approach. Environmental Microbiology. 1: 231-241.
Changes in soil viable microbial biomass and composition reflect disturbance impacts and may serve as quantitative end points for reversibility Microbial community provides multi-species multi-trophic level is analysis >>> single species for Quantitative Toxicity Assessment 4. PHA/PLFA RATIO Sensitive Measure Of Unbalanced Growth Carbon Source + Terminal Electron Acceptor but Lacking Essential Nutrient(s) Necessary For Cell Division Cells attached to fine rootlets PHA/PLFA <<0.01 Cells in sand away from roots PHA/PLFA > 6
Changes in soil viable microbial biomass and composition reflect disturbance impacts and may serve as quantitative end points for reversibility Microbial community provides multi-species multi-trophic level is analysis >>> single species for Quantitative Toxicity Assessment 4. PHA/PLFA TOXICITY INCREASES RATIOWITHTREATMENTRATIO DECREASES Phytoremediation TCE 7 (2). In the rhizosphere of legume 0.0002 in nonvegetated soil Subsurface Petroleum and TCE (+ propane & air) Bioremediation ratio between 5 & 35 compared to 0.08-0.2 without active remediation
Changes in soil viable microbial biomass and composition reflect disturbance impacts and may serve as quantitative end points for reversibility Microbial community provides multi-species multi-trophic level is analysis >>> single species for Quantitative Toxicity Assessment 3. Exposure of pine forest surface soils to vehicular traffic Fort Benning GA Traffic Reference ~ stands of longleaf pines (Pinus palustris) 28-74 years Light ~ limited to infantry Moderate ~ areas exposed to moderate amounts of tracked and light vehicle maneuvers Heavy ~ exclusively for heavy wheeled and tracked vehicle exercises Remediated ~ Vehicles excluded & re-vegetated -
Disturbance Intensity Gradient HeavyModerateLightControlRemediated --Tank Maneuvers--- Turning in Drive on Neutral Tank Trails ----Target Practice--- Heavy Light Artillery Artillery ---Timber Harvest--- Clear Cut Selective Thinning ---Infantry Training--- Troop Individual Maneuvers Orienteering --Longleaf Pines – 24-74 years Vehicles & Infantry Excluded Intensity of Disturbance
Hierarchical Time Overlap of Ecological Disturbance Indicators CenturiesDecadesYears Days Hours Spatial Distribution of Cover Plants Age Distribution of Trees Composition & Distribution of Understory Vegetation Macroinvertebrate Composition Stream Metabolism Storm Concentration Macroinvertebrate Populations -------SOIL MICROORGANISMS------
Changes in soil viable microbial biomass and composition reflect disturbance impacts and may serve as quantitative end points for reversibility Microbial community provides multi-species multi-trophic level is analysis >>> single species for Quantitative Toxicity Assessment 3. Exposure of pine forest surface soils to vehicular traffic Fort Benning GA Traffic disturbance viable biomass (PLFA) 18:0, 20:0, Me Br saturated mono and poly unsaturated, 14:0, 15:0, 16:0 with disturbance in actinomycetes & spore-former Gram positives in gram-negative bacteria and microeukaryotes RECOVERY APPROACHES REFERENCE
Changes in soil viable microbial biomass and composition reflect disturbance impacts and may serve as quantitative end points for reversibility Microbial community provides multi-species multi-trophic level is analysis >>> single species for Quantitative Toxicity Assessment 3. Exposure of pine forest surface soils to vehicular traffic Fort Benning GA Traffic disturbance ~ changes in grasses, trees, bushes & stream properties correlate with usage but requires Biological expertise to differentiate. PLANT COMMUNITIES & STREAM ECOLOGY PARALLEL MICROBES disturbance in actinomycetes & spore-former Gram positives in gram-negative bacteria and microeukaryotes Requires chemistry ~ following protocol. for analysis of lipid biomarkers. RECOVERY APPROACHES REFERENCE
Tree Diagram for 28 PLFA Variables Ward`s method 1-Pearson r Linkage Distance Tree Diagram for 28 PLFA Variables Ward`s method 1-Pearson r i14:0 i14:0 14:0 14:0 15:0 15:0 16:1w7c 16:1w7c 16:0 16:0 16:1w5c 16:1w5c Eukaryote and Gram-negative Bacterial PLFA Eukaryote and Gram-negative Bacterial PLFA 15:1 15:1 br16:0b br16:0b in Gram-negative bacteria and microeukaryotes 18:2w6 18:2w6 18:1w9c 18:1w9c 18:1w5c 18:1w5c 20:3w3 20:3w3 poly20b poly20b 17:1 17:1 20sat 20sat poly20a poly20a cy19:0 cy19:0 i16:0 i16:0 i17:1w7c i17:1w7c Actinomycete Actinomycete, Type PLFA Gram-positive Type PLFA 10Me16:0 10Me16:0 br16:0a br16:0a in actinomycetes & spore-forming bacteria i17:0 i17:0 i10Me16:0 i10Me16:0 12Me18:0 12Me18:0 a17:0 a17:0 17:0 17:0 18:0 18:0 20:0 20:0 0 0 2 2 4 4 6 6 8 8 10 10 Linkage Distance Two clades of microbes disturbance in actinomycetes & spore-former Gram positives, in Gram-negative bacteria and microeukaryotes
PLFA used in Discriminant Analysis a15:0 i17:0 18:1w9c i16:0a17:0 18:0 16:1w7c Cy17:0 10Me18:0 i17:1w7c 17:0 Cy19:0 10Me16:0 i10Me16:0 20’s sat 18:2w6 Linear Discriminant analysis showed that the reference and light transects were very similar while the moderate and heavy transects greatly differed in regards to the microbial community structure.
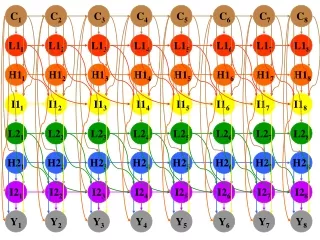
Median Neural Network 61 Inputs (PLFA) 5 Hidden Nodes 4 Outputs R2=0.97
9.00% 8.00% 7.00% 6.00% 5.00% 4.00% 3.00% 2.00% 1.00% Variables with ANN Sensitivity Values over 2% 10.00% 0.00% i16:0 i17:1 16:0 18:0 17:1 15:0 i16:1 17:0 a15:0 a17:0 18:1w7t br19:1a poly20b 18:1w9c 12me16:0 16:1w7c 18:1w5c Gram-Negative, Microeukaryotes, Gram-positive, Actinomycetes
ANN Analysis • Was able to correctly predict classification 66% of the time (25% chance only) • Allowed inspection of novelty indexes which showed that remediated transects are very different from all other treatments HYSTERESESOF RECOVERY
Predictive Analysis of disturbance using the soil microbial community • TWO APPROACHES: • Linear Discriminant model using 17 PLFA predictor variables • Two groups disturbance in actinomycetes & spore-former Gram positive bacteria, in gram-negative bacteria and microeukaryotes • Non-linear Artificial Neural Network Analysis using all 60 PLFAs and microbial biomass • Predict classification 66% of time (Chance = 25%) Hysteresis in recovery from sensitivity
Soil viable microbial biomass and composition reflect disturbance impacts and may serve as quantitative end points for reversibility • Rational (Defensible) End Point • [Multi species, multiple tropic level assessments [vs single species toxicity assessment ] • Recovered ƒ Reversibility of Microbial Community Composition • When uncontaminated soil, periphyton has same, or is approaching the same type of community composition as treated sediment • SURFACE WATER • Biofilms for run-off Diatoms Filamentous Algae (pollution) • SOIL • 2. Petroleum Hydrocarbon Contamination Gram-negative, Biomasss Gram-positive reversed with recovery • 3. PHA/PLFA with pollution recovery • 4. Disturbance (traffic) disturbance in actinomycetes & spore-former Gram positives, in gram-negative bacteria and microeukaryotes reversed with recovery