Download
1 / 38
390 likes | 491 Vues
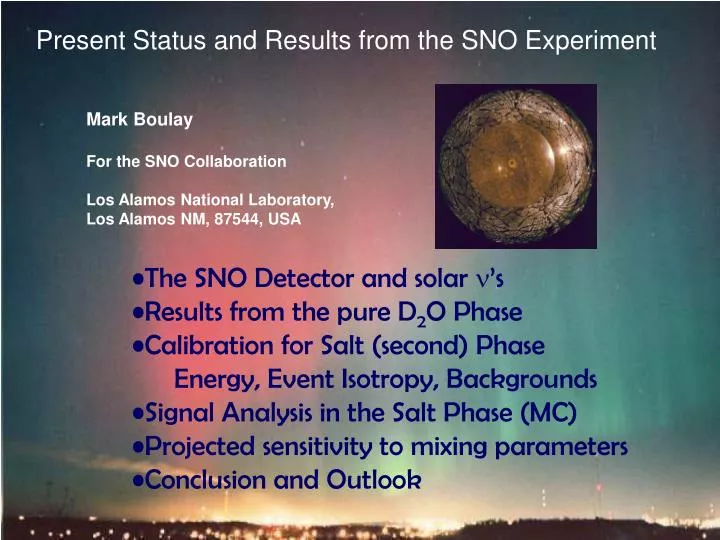
Present Status and Results from the SNO Experiment. Mark Boulay For the SNO Collaboration Los Alamos National Laboratory, Los Alamos NM, 87544, USA. The SNO Detector and solar n ’s Results from the pure D 2 O Phase Calibration for Salt (second) Phase

E N D
Present Status and Results from the SNO Experiment Mark Boulay For the SNO Collaboration Los Alamos National Laboratory, Los Alamos NM, 87544, USA • The SNO Detector and solar n’s • Results from the pure D2O Phase • Calibration for Salt (second) Phase • Energy, Event Isotropy, Backgrounds • Signal Analysis in the Salt Phase (MC) • Projected sensitivity to mixing parameters • Conclusion and Outlook
The SNO Collaboration J.D. Anglin, M. Bercovitch, W.F. Davidson, R.S. Storey* National Research Council of Canada J.C. Barton, S. Biller, R.A. Black, R.J. Boardman, M.G. Bowler, J. Cameron, B.T. Cleveland, X. Dai, G. Doucas, J.A. Dunmore, H. Fergani, A.P. Ferrarris, K. Frame, N. Gagnon, H. Heron, N.A. Jelley, A.B. Knox, M. Lay, W. Locke, J. Lyon, S. Majerus, G. McGregor, M. Moorhead, M. Omori, C.J. Sims, N.W. Tanner, R.K. Taplin, M.Thorman, P.M. Thornewell, P.T. Trent, N. West, J.R. Wilson University of Oxford E.W. Beier, D.F. Cowen, M. Dunford, E.D. Frank, W. Frati, W.J. Heintzelman, P.T. Keener, J.R. Klein, C.C.M. Kyba, N. McCauley, D.S. McDonald, M.S. Neubauer, F.M. Newcomer, S.M. Oser, V.L Rusu, S. Spreitzer, R. Van Berg, P. Wittich University of Pennsylvania R. Kouzes Princeton University E. Bonvin, M. Chen, E.T.H. Clifford, F.A. Duncan, E.D. Earle, H.C. Evans, G.T. Ewan, R.J. Ford, K. Graham, A.L. Hallin, W.B. Handler, P.J. Harvey, J.D. Hepburn, C. Jillings, H.W. Lee, J.R. Leslie, H.B. Mak, J. Maneira, A.B. McDonald, B.A. Moffat, T.J. Radcliffe, B.C. Robertson, P. Skensved Queen’s University D.L. Wark Rutherford Appleton Laboratory, University of Sussex R.L. Helmer, A.J. Noble TRIUMF Q.R. Ahmad, M.C. Browne, T.V. Bullard, G.A. Cox, P.J. Doe, C.A. Duba, S.R. Elliott, J.A. Formaggio, J.V. Germani, A.A. Hamian, R. Hazama, K.M. Heeger, K. Kazkaz, J. Manor, R. Meijer Drees, J.L. Orrell, R.G.H. Robertson, K.K. Schaffer, M.W.E. Smith, T.D. Steiger, L.C. Stonehill, J.F. Wilkerson University of Washington G. Milton, B. Sur Atomic Energy of Canada Ltd., Chalk River Laboratories S. Gil, J. Heise, R.J. Komar, T. Kutter, C.W. Nally, H.S. Ng, Y.I. Tserkovnyak, C.E. Waltham University of British Columbia J. Boger, R.L Hahn, J.K. Rowley, M. Yeh Brookhaven National Laboratory R.C. Allen, G. Bühler,H.H.Chen* University of California, Irvine I. Blevis, F. Dalnoki-Veress, D.R. Grant, C.K. Hargrove, I. Levine, K. McFarlane, C. Mifflin, V.M. Novikov, M. O'Neill, M. Shatkay, D. Sinclair, N. Starinsky Carleton University T.C. Andersen, P. Jagam, J. Law, I.T. Lawson, R.W. Ollerhead, J.J. Simpson, N. Tagg, J.-X. Wang University of Guelph J. Bigu, J.H.M. Cowan, J. Farine, E.D. Hallman, R.U. Haq, J. Hewett, J.G. Hykawy, G. Jonkmans, S. Luoma, A. Roberge, E. Saettler, M.H. Schwendener, H. Seifert, R. Tafirout, C.J. Virtue Laurentian University Y.D. Chan, X. Chen, M.C.P. Isaac, K.T. Lesko, A.D. Marino, E.B. Norman, C.E. Okada, A.W.P. Poon, S.S.E Rosendahl, A. Schülke, A.R. Smith, R.G. Stokstad Lawrence Berkeley National Laboratory M.G. Boulay, T.J. Bowles, S.J. Brice, M.R. Dragowsky, M.M. Fowler, A.S. Hamer, A. Hime, G.G. Miller, R.G. Van de Water, J.B. Wilhelmy, J.M. Wouters Los Alamos National Laboratory
The Solar Neutrino Problem Figure by J. Bahcall Experiment Exp/SSM • SAGE+GALLEX/GNO 0.58 • Homestake 0.33 • Kamiokande+SuperK 0.46 • SNO CC (June 2001) 0.35 SNO NC (April 2002) ~1 SNO CC vs NC implies flavor change, which can then explain other experimental results.
The SNO Detector Nucl. Inst. and Meth. A449, p172 (2000)
n + + + n NC d p n x x Neutrino Reactions in SNO n + + + CC d p p e− e • Q = 1.445 MeV • good measurement of ne energy spectrum • some directional info (1 – 1/3 cosq) • ne only • Q = 2.22 MeV • measures total 8B n flux from the Sun • equal cross section for all n types + + n e− n e− ES x x • low statistics • mainly sensitive to ne, some n and n • strong directional sensitivity
Solar Neutrino Physics with SNO What can we learn from measuring the NC interaction rate and the Day/Night variations of the 8B Flux? Total 8B flux (NC) e flux (CC) CCSNO/NCSNO Test of neutrino flavor change Total flux of solar 8B neutrinos Test of solar models Diurnal time dependence Test of neutrino oscillations Electron neutrino energy spectrum Distortions in 8B spectrum?
SNO’s response to neutron events (solar NC signal) Phase II (dissolved salt): Phase III (3He n counters): Phase I (pure D2O): n3He p t Neutron capture on D Neutron capture on Cl Multiple g s, 8.6 MeV Single 6.25 MeV g Statistical separation (Energy, radius) Statistical separation (Isotropy) Independent channel NC uncorrelated to CC High CC-NC correlation Better CC-NC separation Future Present Past
Statistical Signal Separation (D2O phase analysis) • Signal PDFs used for statistical separation Maximum Likelihood fit for n fluxes SNO response in event radius, energy and direction to solar neutrinos through CC, ES, and NC reactions
CC 1967.7 #EVENTS +61.9 +26.4 +49.5 +60.9 +25.6 +48.9 ES 263.6 NC 576.5 Shape Constrained Signal Extraction Results (Pure D2O phase)
Flux Results – Pure D2O Phase Neutrinos change flavour Constrained Fit for flavour change test Without Constraint
Physics Interpretation – Neutrino Oscillations SNO D2O results, pre-KAMLAND SNO Day and Night Energy Spectra Alone Combining All Experimental and Solar Model information
Salt Phase Dataset (Analysis being completed now) • Salt added to detector • May 27, 2001 to October 10, 2002 • 503 days • ~280 neutrino live-days (57.4%) • improved NC statistics • improved CC-NC separation from isotropy • Improved measurement of external neutron backgrounds →improved measurement of CC/NC ratio → precision unconstrained result
What We Measure PMT Measurements • position • charge • time Reconstructed Event -event vertex -event direction -energy -isotropy
Pulsers Pulsed Laser 16N 3H(p,g)4He 8Li 252Cf U/Th 337nm to 620 nm 6.13 MeV g’s 19.8 MeV g’s <13.0 MeV b’s neutrons 214Bi & 208Tl b-g’s SNO Detector Calibration MonteCarlo Cherenkov production (e-, g, b-g) Photon propagation and detection Neutron transport and capture Reconstruction (position, direction, energy, isotropy) Calibration
Vertex Reconstruction of Events • PMT times used to reconstruct event position • Resolution ~15 cm UNTAGGED TAGGED
Energy Calibration Prompt time cut applied to accept only direct photons Reduces uncertainty due to scattering Corrections for detector optics, dead PMTs, and gain applied No. prompt hits vs. electron energy determined from MC calculations (SNOMAN EGS)
Energy Scale Calibration in Salt Phase Relative gain from 16N calibration Energy scale drift agrees with MC prediction Due to small increase with time in D2O photon absorption. Data MC
Reponse to Neutrons in Salt • Capture on 35Cl a36Cl cascade • Multi-photon events aisotropy • Energy peaks higher Signature of NC reaction n 35Cl 36Cl g (Eg = 8.6 MeV)
Event Isotropy Calibration in Salt Phase 16N calibration source b14 252Cf source See next talk J. Dunmore b14
Neutron Response Factor of ~3-4 increase in stats - larger capture cross-section - energy reponse peaks higher Pure D2O Volume weighted efficiency 14.38 +/- 0.53 % • Systematics Include: • energy scale and resolution • vertex reconstruction • source position • 252Cf source strength • burst selection • background Salt Phase Salt Volume weighted efficiency 41.3 x [1 +/- 0.038] % Total aFew Percent Level Preliminary PRELIMINARY
Fitting external source neutron backgrounds in salt Increased n capture efficiency on Cl allows separation of internal and external (background) sources of neutrons Maximum likelihood fit to extract external source neutron background events r=(r/600)3 Monte-Carlo simulation
Signal Bkg } CC NC ES Fe Fmt Cerenkov Photodis. Fit Fix Perturb Shift Variables PDF’s Neutrino Flux Analysis for Salt Phase NC E higher Unconstrained Less Rad. Sep. Variables: E, R3, cosqsun, b14 8B Shape Constrained Statistical Signal Separation Energy R3 qij cosqsun b14 Extended ML Fit aFluxes aSystematic Uncertainties Isotropy Separation Directionality Unchanged
Fit Result Uncertainties (Monte-Carlo) D2O results Simulated Salt Phase Results Published D2O energy-unconstrained stat. Error was 24% Simulations assume 1 yr of data with central values and cuts from D2O phase results
Projected sensitivity from SNO salt phase Projected limit on maximal 1-2 mixing Assuming D2O phase NC result Projected Sensitivity to Mixing Parameters Combined Solar + KAMLAND data Figure adapted from Holanda and Smirnov, hep-ph/0212270
Summary From pure D2O Phase (Phase I): Flavour Transformation Neutrinos Massive SSM agreement Combined n Results: MSW Model -> LMA Favoured Region (now confirmed by KamLAND) From Salt Phase (Phase II): (expect this) Increased NC statistics – Additional Isotropy Separation Precision Fluxes without Shape Constraint Improved CC/NC Measurement Model independent NC measurement Limit on q12, and on maximal mixing Currently finalizing systematics and analysis for salt phase dataset Next Phase (Phase III): NCDs soon Independent NC channel
The SNO Collaboration J.D. Anglin, M. Bercovitch, W.F. Davidson, R.S. Storey* National Research Council of Canada J.C. Barton, S. Biller, R.A. Black, R.J. Boardman, M.G. Bowler, J. Cameron, B.T. Cleveland, X. Dai, G. Doucas, J.A. Dunmore, H. Fergani, A.P. Ferrarris, K. Frame, N. Gagnon, H. Heron, N.A. Jelley, A.B. Knox, M. Lay, W. Locke, J. Lyon, S. Majerus, G. McGregor, M. Moorhead, M. Omori, C.J. Sims, N.W. Tanner, R.K. Taplin, M.Thorman, P.M. Thornewell, P.T. Trent, N. West, J.R. Wilson University of Oxford E.W. Beier, D.F. Cowen, M. Dunford, E.D. Frank, W. Frati, W.J. Heintzelman, P.T. Keener, J.R. Klein, C.C.M. Kyba, N. McCauley, D.S. McDonald, M.S. Neubauer, F.M. Newcomer, S.M. Oser, V.L Rusu, S. Spreitzer, R. Van Berg, P. Wittich University of Pennsylvania R. Kouzes Princeton University E. Bonvin, M. Chen, E.T.H. Clifford, F.A. Duncan, E.D. Earle, H.C. Evans, G.T. Ewan, R.J. Ford, K. Graham, A.L. Hallin, W.B. Handler, P.J. Harvey, J.D. Hepburn, C. Jillings, H.W. Lee, J.R. Leslie, H.B. Mak, J. Maneira, A.B. McDonald, B.A. Moffat, T.J. Radcliffe, B.C. Robertson, P. Skensved Queen’s University D.L. Wark Rutherford Appleton Laboratory, University of Sussex R.L. Helmer, A.J. Noble TRIUMF Q.R. Ahmad, M.C. Browne, T.V. Bullard, G.A. Cox, P.J. Doe, C.A. Duba, S.R. Elliott, J.A. Formaggio, J.V. Germani, A.A. Hamian, R. Hazama, K.M. Heeger, K. Kazkaz, J. Manor, R. Meijer Drees, J.L. Orrell, R.G.H. Robertson, K.K. Schaffer, M.W.E. Smith, T.D. Steiger, L.C. Stonehill, J.F. Wilkerson University of Washington G. Milton, B. Sur Atomic Energy of Canada Ltd., Chalk River Laboratories S. Gil, J. Heise, R.J. Komar, T. Kutter, C.W. Nally, H.S. Ng, Y.I. Tserkovnyak, C.E. Waltham University of British Columbia J. Boger, R.L Hahn, J.K. Rowley, M. Yeh Brookhaven National Laboratory R.C. Allen, G. Bühler,H.H.Chen* University of California, Irvine I. Blevis, F. Dalnoki-Veress, D.R. Grant, C.K. Hargrove, I. Levine, K. McFarlane, C. Mifflin, V.M. Novikov, M. O'Neill, M. Shatkay, D. Sinclair, N. Starinsky Carleton University T.C. Andersen, P. Jagam, J. Law, I.T. Lawson, R.W. Ollerhead, J.J. Simpson, N. Tagg, J.-X. Wang University of Guelph J. Bigu, J.H.M. Cowan, J. Farine, E.D. Hallman, R.U. Haq, J. Hewett, J.G. Hykawy, G. Jonkmans, S. Luoma, A. Roberge, E. Saettler, M.H. Schwendener, H. Seifert, R. Tafirout, C.J. Virtue Laurentian University Y.D. Chan, X. Chen, M.C.P. Isaac, K.T. Lesko, A.D. Marino, E.B. Norman, C.E. Okada, A.W.P. Poon, S.S.E Rosendahl, A. Schülke, A.R. Smith, R.G. Stokstad Lawrence Berkeley National Laboratory M.G. Boulay, T.J. Bowles, S.J. Brice, M.R. Dragowsky, M.M. Fowler, A.S. Hamer, A. Hime, G.G. Miller, R.G. Van de Water, J.B. Wilhelmy, J.M. Wouters Los Alamos National Laboratory
Energy Systematics Sources Include: Detector State Stability a16N Runs Optical Model Radial/Asymmetry Studies Timing Total Uncertainty ~1-2% Preliminary Data – June 2001 scan Data – May 2002 scan Data – January 2003 scan MC – May 2002 scan
Calibration Radon Spike in SNO Detector Rn injected into D2O region
External 24Na Injection Ended Salt Injected on May 28, 2001 24Na Background Injection began t1/2=14.95 hrs Counts The NaCl brine in the underground buffer tank was activated by neutrons from the rock wall. We observed the decay of 24Na after the brine is injected in the SNO detector. -200 -100 0 100 200 Time Since Salt Injection (hrs)
Fcc ne = Fnc ne +nm+ nt Fday Fnight vs Key signatures for n oscillations Measure total flux of solar neutrinos vs. the pure ne flux Fcc ne June 2001 = Evidencefor n flavor change Fes ne + 0.154(nm+ nt) April 2002 Potential signal for n oscillations April 2002
24Na 2.75 MeV 1.37 MeV 24Mg Background Measurements in Salt Phase Containerless source • A hot Th source is used to photodisintegrate the deuteron. The resulting neutrons activate the 23Na nuclei in the salt • Used to test the low energy response of the detector, and to calibrate the light isotropy parameters used in the low energy background in-situ analysis • Used to trace the water flow pattern in the ex-situ assay of radioactive backgrounds t1/2=14.95h