Download
1 / 25
320 likes | 698 Vues
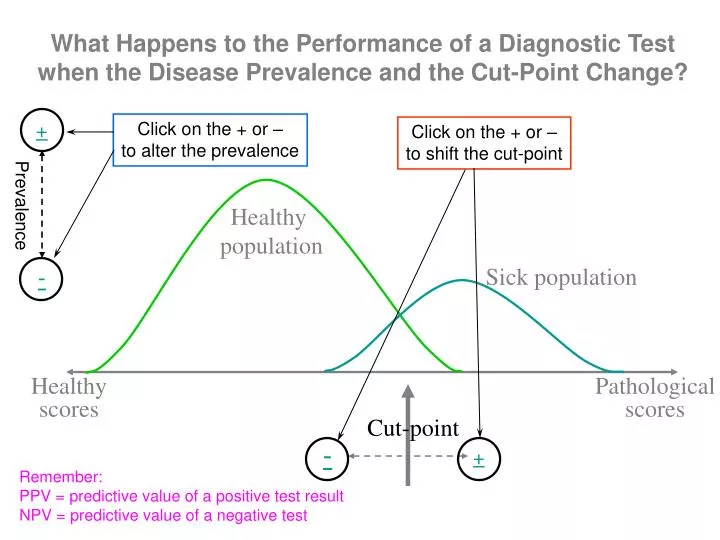
What Happens to the Performance of a Diagnostic Test when the Disease Prevalence and the Cut-Point Change?. +. Click on the + or – to alter the prevalence. Click on the + or – to shift the cut-point. Prevalence. Healthy population. Sick population. -. Healthy scores. Pathological scores.

E N D
What Happens to the Performance of a Diagnostic Test when the Disease Prevalence and the Cut-Point Change? + Click on the + or –to alter the prevalence Click on the + or –to shift the cut-point Prevalence Healthy population Sick population - Healthyscores Pathologicalscores Cut-point - + Remember: PPV = predictive value of a positive test result NPV = predictive value of a negative test
PPV 80/107 74.8% NPV 275/295 93.2% Sensitivity 82/100 82% Specificity 275/300 91.7% + Disease + − + Test − 82 18 25 275 25% Prevalence Healthy population Sick population − Healthyscores Pathologicalscores Cut-point − +
PPV 73/93 78.5% NPV 280/307 91.2% Sensitivity 73/100 73% Specificity 280/300 93.3% + Disease + − + Test − 73 27 20 280 25% Prevalence Healthy population Sick population − Healthyscores Pathologicalscores Cut-point − +
PPV 70/85 82.4% NPV 285/315 90.5% Sensitivity 70/100 70% Specificity 285/300 95% + Disease + − + Test − 70 30 15 285 25% Prevalence Healthy population Sick population − Healthyscores Pathologicalscores Cut-point − +
PPV 63/70 86.3% NPV 290/327 88.7% Sensitivity 63/100 63% Specificity 290/300 96.7% + Disease + − + Test − 63 37 10 290 25% Prevalence Healthy population Sick population − Healthyscores Pathologicalscores Cut-point − +
PPV 52/52 100% NPV 300/348 86.2% Sensitivity 52/100 52% Specificity 300/300 100% + Disease + − + Test − 52 48 0 300 25% Prevalence Healthy population Sick population − Healthyscores Pathologicalscores Cut-point −
PPV 90/135 66.7% NPV 255/265 96.2% Sensitivity 90/100 90% Specificity 255/300 85% + Disease + − + Test − 90 10 45 255 25% Prevalence Healthy population Sick population − Healthyscores Pathologicalscores Cut-point − +
PPV 95/161 59% NPV 234/239 97.9% Sensitivity 95/100 95% Specificity 234/300 78% + Disease + − + Test − 95 5 66 234 25% Prevalence Healthy population Sick population − Healthyscores Pathologicalscores Cut-point − +
PPV 100/205 48.8% NPV 195/195 100% Sensitivity 100/100 100% Specificity 195/300 65% + Disease + − + Test − 100 0 105 195 25% Prevalence Healthy population Sick population − Healthyscores Pathologicalscores Cut-point +
PPV 49/91 53.8% NPV 458/469 97.7% Sensitivity 49/60 82% Specificity 458/500 91.6% + Disease + − + Test − 49 11 42 458 Prevalence Healthy population 10% Sick population Healthyscores Pathologicalscores Cut-point − +
PPV 44/77 57.1% NPV 467/483 96.9% Sensitivity 44/60 73.3% Specificity 467/500 93.4% + Disease + − + Test − 44 16 33 467 Prevalence Healthy population 10% Sick population Healthyscores Pathologicalscores Cut-point − +
PPV 42/67 62.7% NPV 475/493 96.4% Sensitivity 42/60 70% Specificity 475/500 95% + Disease + − + Test − 42 18 25 475 Prevalence Healthy population 10% Sick population Healthyscores Pathologicalscores Cut-point − +
PPV 38/53 71.7% NPV 485/506 95.8% Sensitivity 38/60 63.3% Specificity 485/500 97% + Disease + − + Test − 38 22 15 485 Prevalence Healthy population 10% Sick population Healthyscores Pathologicalscores Cut-point − +
PPV 31/31 100% NPV 500/529 94.5% Sensitivity 31/60 51.7% Specificity 500/500 100% + Disease + − + Test − 31 29 0 500 Prevalence Healthy population 10% Sick population Healthyscores Pathologicalscores Cut-point −
PPV 54/129 41.9% NPV 425/431 98.6% Sensitivity 54/60 90% Specificity 425/500 85% + Disease + − + Test − 54 6 75 425 Prevalence Healthy population 10% Sick population Healthyscores Pathologicalscores Cut-point − +
PPV 57/167 34.1% NPV 390/393 99.2% Sensitivity 57/60 95% Specificity 390/500 78% + Disease + − + Test − 57 3 110 390 Prevalence Healthy population 10% Sick population Healthyscores Pathologicalscores Cut-point − +
PPV 60/235 25.5% NPV 325/325 100% Sensitivity 60/60 100% Specificity 325/500 65% + Disease + − + Test − 60 0 175 325 Prevalence Healthy population 10% Sick population Healthyscores Pathologicalscores Cut-point +
PPV 82/90 91% NPV 92/110 83.6% Sensitivity 82/100 82% Specificity 92/100 92% Disease + − + Test − 82 18 8 92 50% Prevalence Healthy population Sick population − Healthyscores Pathologicalscores Cut-point − +
PPV 73/80 91.3% NPV 93/120 77.5% Sensitivity 73/100 73% Specificity 93/100 93% Disease + − + Test − 73 27 7 93 50% Prevalence Healthy population Sick population − Healthyscores Pathologicalscores Cut-point − +
PPV 70/75 93.3% NPV 95/125 76% Sensitivity 70/100 70% Specificity 95/100 95% Disease + − + Test − 70 30 5 95 50% Prevalence Healthy population Sick population − Healthyscores Pathologicalscores Cut-point − +
PPV 63/66 95.5% NPV 97/134 72.4% Sensitivity 63/100 63% Specificity 97/100 97% Disease + − + Test − 63 37 3 97 50% Prevalence Healthy population Sick population − Healthyscores Pathologicalscores Cut-point − +
PPV 52/52 100% NPV 100/148 67.6% Sensitivity 52/100 52% Specificity 100/100 100% Disease + − + Test − 52 48 0 100 50% Prevalence Healthy population Sick population − Healthyscores Pathologicalscores Cut-point −
PPV 90/105 85.7% NPV 85/95 89.5% Sensitivity 90/100 90% Specificity 85/100 85% Disease + − + Test − 90 10 15 85 50% Prevalence Healthy population Sick population − Healthyscores Pathologicalscores Cut-point − +
PPV 95/117 81.2% NPV 78/83 94% Sensitivity 95/100 95% Specificity 78/100 78% Disease + − + Test − 95 5 22 78 50% Prevalence Healthy population Sick population − Healthyscores Pathologicalscores Cut-point − +
PPV 100/135 74% NPV 65/65 100% Sensitivity 100/100 100% Specificity 65/100 65% Disease + − + Test − 100 0 35 65 50% Prevalence Healthy population Sick population − Healthyscores Pathologicalscores Cut-point +