Download
1 / 4
40 likes | 45 Vues
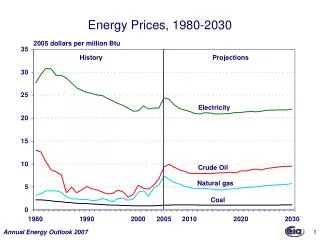
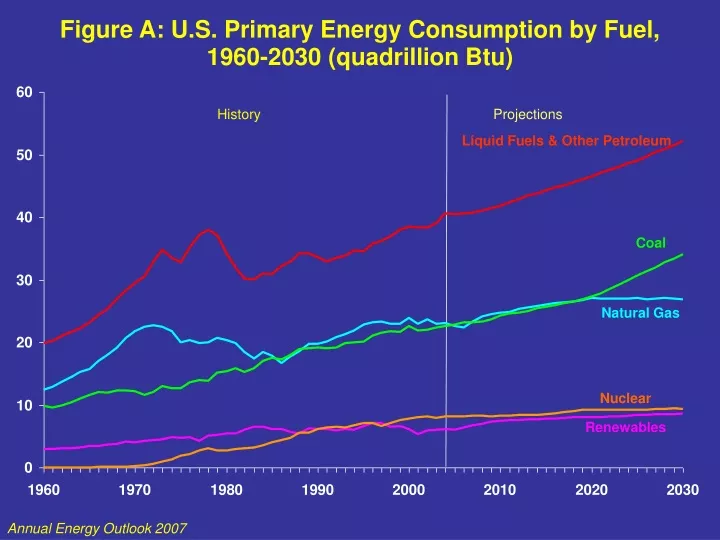
Figure A: U.S. Primary Energy Consumption by Fuel, 1960-2030 (quadrillion Btu). History. Projections. Liquid Fuels & Other Petroleum. Coal. Natural Gas. Nuclear. Renewables. Annual Energy Outlook 2007. Figure B: Total Domestic Production.

E N D
Figure A: U.S. Primary Energy Consumption by Fuel, 1960-2030 (quadrillion Btu) History Projections Liquid Fuels & Other Petroleum Coal Natural Gas Nuclear Renewables Annual Energy Outlook 2007
Figure B: Total Domestic Production Source: Energy Information Administration Annual Energy Outlook 2007 (Early Release) Note: The forecast of OCS production may contain small amounts of production from State waters in northern Alaska. However, the Alaska OCS numbers are consistent with MMS estimates and rarely exceed 10 percent of total OCS production.