Download
1 / 1
10 likes | 196 Vues
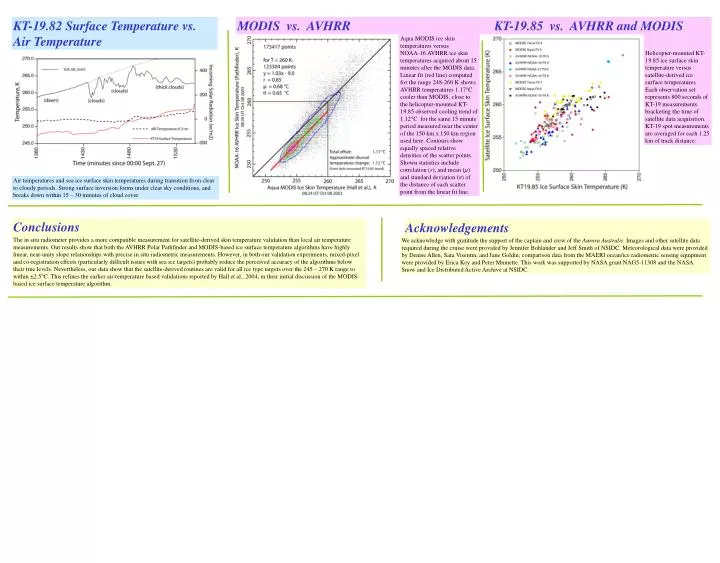
KT-19.82 Surface Temperature vs. Air Temperature. MODIS vs. AVHRR. KT-19.85 vs. AVHRR and MODIS. Aqua MODIS ice skin temperatures versus

E N D
KT-19.82 Surface Temperature vs. Air Temperature MODIS vs. AVHRR KT-19.85 vs. AVHRR and MODIS Aqua MODIS ice skin temperatures versus NOAA-16 AVHRR ice skin temperatures acquired about 15 minutes after the MODIS data. Linear fit (red line) computed for the range 248-260 K shows AVHRR temperatures 1.17°C cooler than MODIS, close to the helicopter-mounted KT-19.85 observed cooling trend of 1.12°C for the same 15 minute period measured near the center of the 150 km x 150 km region used here. Contours show equally spaced relative densities of the scatter points. Shown statistics include correlation (r), and mean (µ) and standard deviation (σ) of the distance of each scatter point from the linear fit line. Helicopter-mounted KT-19.85 ice surface skin temperature versus satellite-derived ice surface temperatures. Each observation set represents 800 seconds of KT-19 measurements bracketing the time of satellite data acquisition. KT-19 spot measurements are averaged for each 1.25 km of track distance. Air temperatures and sea ice surface skin temperatures during transition from clear to cloudy periods. Strong surface inversion forms under clear sky conditions, and breaks down within 15 – 30 minutes of cloud cover. Conclusions Acknowledgements The in situ radiometer provides a more compatible measurement for satellite-derived skin temperature validation than local air temperature measurements. Our results show that both the AVHRR Polar Pathfinder and MODIS-based ice surface temperature algorithms have highly linear, near-unity slope relationships with precise in situ radiometric measurements. However, in both our validation experiments, mixed-pixel and co-registration effects (particularly difficult issues with sea ice targets) probably reduce the perceived accuracy of the algorithms below their true levels. Nevertheless, our data show that the satellite-derived routines are valid for all ice type targets over the 245 – 270 K range to within ±2.5°C. This refines the earlier air-temperature based validations reported by Hall et al., 2004, in their initial discussion of the MODIS-based ice surface temperature algorithm. We acknowledge with gratitude the support of the captain and crew of the Aurora Australis. Images and other satellite data required during the cruise were provided by Jennifer Bohlander and Jeff Smith of NSIDC. Meteorological data were provided by Denise Allen, Sara Visentin, and Jane Goldin; comparison data from the MAERI ocean/ice radiometric sensing equipment were provided by Erica Key and Peter Minnette. This work was supported by NASA grant NAG5-11308 and the NASA Snow and Ice Distributed Active Archive at NSIDC.