Download

1 / 33
340 likes | 562 Vues
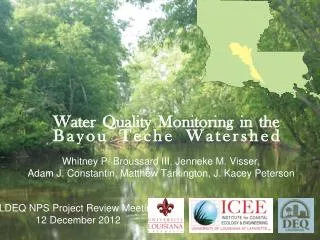
Investigating the Linkage between Water Quality and Water Quantity in Watershed Management. Richard L. Kiesling 1 United States Geological Survey, Water Resource Division, Texas District, 8027 Exchange Drive, Austin, TX, 78754

E N D
Investigating the Linkage between Water Quality and Water Quantity in Watershed Management Richard L. Kiesling 1United States Geological Survey, Water Resource Division, Texas District, 8027 Exchange Drive, Austin, TX, 78754 2Environmental Science Institute, University of Texas, Austin, TX, 78712
Why Evaluate Impact of Streamflow? • Streamflow acts as a master variable • Controls Water Residence Time • Regulates Rates of Physical Disturbance • Regulates Nutrient and Carbon Cycling • nutrient uptake length a function of stream depth and velocity (e.g., Valett et al. 1996) • nutrient assimilation and turnover rates a function of discharge (Butterini and Sabater 1998). • Regulates Channel Characteristics • Hydro-geomorphology
Water Resource Functions • Aesthetics – enhancement of property values • Habitat – fish and wildlife survival and reproduction • Hydro-electric power generation • Recreation – swimming, boating, fishing • Seafood production – freshwater inflows for shellfish and finfish production • Water quality – assimilation of waste and production of safe drinking water • Water supply – Ag, Domestic, Industrial, Recreation
Investigating the Linkage • Approach – • Technical evaluation of the impact of instream flows on wastewater effluent assimilation • Methodology – • Run calibrated QUAL-TX water quality model with alternative instream flow criteria • Compare model output for alternative effluent sets under different static flow conditions
Acknowledgments • TCEQ • Joan Flowers, Carter and Burgess • TIAER • US EPA • Tarleton State University • Amy Findley • Jeff Back
Water Quality Simulations: Rio Grande • Calibrated QUAL-TX Model • Modified Headwater Flow • 60% and 40% of median daily flow from Fort Quitman Gage 1923 through 1950 (3.6 m3/sec and 2.4m3/sec) • Conserved Pollutant Load • Modeled Alternative Load Scenarios • Increased BOD load by 20mg/L for two flow scenarios • Compared Predicted Instream [DO]
Water Quality Simulations: North Bosque • Used Calibrated TNRCC QUAL-TX Model • Modified Headwater Flow • Default Instream Flow restriction based on 60% or 40% of median daily flow recorded at Clifton Gage • Conserved Pollutant Load • Modeled Alternative Load Scenarios • Increased BOD load by 20mg/L for two flow scenarios • Compared Predicted Instream [DO]
BO040 BO060 BO070 BO090 NC060 TIAER Graphic; used by permission
Simulation Number Headwater flow (cfs) Clifton BOD (mg/L) Clifton NH3-N (mg/L) Valley Mills BOD (mg/L) Valley Mills NH3-N (mg/L) TCEQ/ TNRCC 0.002 10 12 10 12 1 4.9 10 12 10 12 2 1.0 10 12 10 12 3 0.6 10 12 10 12 4 4.9 20 15 10 12 5 4.9 10 12 20 15 6 0.6 20 15 10 12 7 0.6 10 12 20 15 8 0.002 20 15 10 12 9 0.002 10 12 20 15 North Bosque: Alternative Load Scenarios
Downstream Upstream
Simulation Study Conclusions • Maintenance of instream flows above critical low flows increased modeled assimilative capacity • Potential exists for economic trade-off between wastewater treatment costs and instream flow to maintain assimilative capacity • Integrated water resource management requires the simultaneous assessment of streamflow manipulation and assimilative capacity • Does this apply to all constiuents?
System Model of Nutrients and Watershed Eutrophication • Nutrient supply can limit algal production • Nutrient enrichment from watershed and marine sources can control extent of limitation • Control Points within watersheds dictate trophic-level responses to nutrient enrichment; for example • Frequency and magnitude of loads • Spatial and temporal change in LULC • Hydro modification (entrenchment, diking)
NDS periphytometers apparatus design – Liquid media diffusing through two-layer substrate 0.45 micron nylon barrier filter GFF substrate - analyzed for algal biomass or carbon Factorial Experiments – factors, 1 level each, interaction term Six Sites in North Bosque River Watershed Nutrient media additions of 350 uM N and 100 uM P Eight replicates per treatments 10-14 day deployments; micro and macro methods In-stream Methods: algal production
BO040 BO060 BO070 BO090 NC060 TIAER Graphic; used by permission
Conclusions: Watershed Eutrophication • Nutrient-limited periphyton primary production conforms to resource-consumer model of population growth based on resource supply rate • Periphyton primary productivity is elevated along the instream nutrient concentration gradient, documenting a change in trophic status • Periphyton and water-column primary productivity at Clifton (BO090) track mean discharge as well as nutrient concentration
Micro-NDS Periphytometer Taos Ski Valley, New Mexico • Dr. Richard Kiesling • US Geological Survey • 8027 Exchange Drive • Austin, TX 78754 • kiesling@usgs.gov • (512) 927-3505 Micro-NDS Periphytometer Steer Creek, Oregon
Dr. Richard Kiesling US Geological Survey 8027 Exchange Drive Austin, TX 78754 kiesling@usgs.gov (512) 927-3505 Contact Information
Buffalo Bayou Example • Proposed to augment flow of Buffalo Bayou from upstream flood control reservoir • Maximum annual demand for instream flow releases was 62,985 ac-ft per year • WWTP alternative cost $22.1 million for construction and operation (2001 dollars) • Alternatives approximately equivalent at raw water cost of $350 per ac-ft (2001 dollars)
Economic Evaluation Observations • Example illustrates the potential for benefits analysis associated with the maintenance of instream flows • Example demonstrates the potential value of integrated functional analysis of water quality and water quantity • Raises questions regarding costs estimates available for this type of planning exercise
Water Quality Simulations: Rio Grande • Calibrated QUAL-TX Model • Modified Headwater Flow • 60% and 40% of median daily flow from Fort Quitman Gage 1923 through 1950 (3.6 m3/sec and 2.4m3/sec) • Conserved Pollutant Load • Modeled Alternative Load Scenarios • Increased BOD load by 20mg/L for two flow scenarios • Compared Predicted Instream [DO]