Download
1 / 48
480 likes | 500 Vues
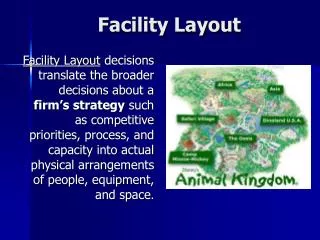
FACILITY LAYOUT. Facility layout means : the configuration of departments, work centers, and equipment, with particular emphasis on the flow patterns of materials and people around, into, and within buildings . Layout decisions are very important because they

E N D
FACILITY LAYOUT • Facility layout means: the configuration of departments, work centers, and equipment, with particular emphasis on the flow patterns of materials and people around, into, and within buildings. • Layout decisions are very important because they - Require substantial investments of money and effort - Involve long-term commitments - Have significant impact on cost and efficiency of short-term operations
Characteristics of the Facility Layout Decisions • Location of the work centers and departments impacts the flow through the system. • The layout can affect productivity and costs generated by the system. • Layout alternatives are limited by • the amount and type of space required for the various areas • the amount and type of space available • the operations strategy • . . . more
Characteristics of the Facility Layout Decision • Layout decisions tend to be: • Infrequent • Expensive to implement • Studied and evaluated extensively • Long-term commitments
Basic Layout Forms • Process • Product • Cellular • Fixed position • Hybrid
Process (Job Shop) Layouts • Equipment that perform similar processes are grouped together • Used when the operations system must handle a wide variety of products in relatively small volumes (i.e., flexibility is necessary)
Dept. A Dept. C Dept. E Dept. B Dept. D Dept. F Process Layout Process Layout (functional) Used for Intermittent processing Job Shop or Batch
Characteristics of Process Layouts • General-purpose equipment is used • Changeover is rapid • Material flow is intermittent • Material handling equipment is flexible • Operators are highly skilled • Technical supervision is required • Planning, scheduling and controlling functions are challenging • Production time is relatively long • In-process inventory is relatively high
Product (Assembly Line) Layouts • Operations are arranged in the sequence required to make the product • Used when the operations system must handle a narrow variety of products in relatively high volumes • Operations and personnel are dedicated to producing one or a small number of products
Product Layout Figure 6.4 Raw materials or customer Station 2 Station 3 Station 4 Finished item Station 1 Material and/or labor Material and/or labor Material and/or labor Material and/or labor Used for Repetitive or Continuous Processing
Characteristics of Product Layouts • Special-purpose equipment are used • Changeover is expensive and lengthy • Material flow approaches continuous • Material handling equipment is fixed • Operators need not be as skilled • Little direct supervision is required • Planning, scheduling and controlling functions are relatively straight-forward • Production time for a unit is relatively short • In-process inventory is relatively low
Cellular Manufacturing (CM) Layouts • Operations required to produce a particular family (group) of parts are arranged in the sequence required to make that family • Used when the operations system must handle a moderate variety of products in moderate volumes
Characteristics of CMRelative to Process Layouts • Equipment can be less general-purpose • Material handling costs are reduced • Training periods for operators are shortened • In-process inventory is lower • Parts can be made faster and shipped more quickly
Characteristics of CMRelative to a Product Layout • Equipment can be less special-purpose • Changeovers are simplified • Production is easier to automate
Fixed-Position Layouts • Product remains in a fixed position, and the personnel, material and equipment come to it • Used when the product is very bulky, large, heavy or fragile
Hybrid Layouts • Actually, most manufacturing facilities use a combination of layout types. • An example of a hybrid layout is where departments are arranged according to the types of processes but the products flow through on a product layout.
New Trends in Manufacturing Layouts • Designed for quality and flexibility • Ability to quickly shift to different product models or to different production rates • Cellular layout within larger process layouts • Automated material handling such as automated guided vehicle systems (AGVs)and automated storage and retrieval sytems (AS/RS) • U-shaped production lines have potential to improve employee morale • More open work areas with fewer walls, partitions, or other obstacles • Smaller and more compact factory layouts • Less space provided for storage of inventories throughout the layout
1 2 3 4 In 5 Workers 6 Out 10 9 8 7 A U-Shaped Production Line
Designing and Analyzing a Product Layout • Line Balancing Problem • Characteristics • Inputs • Design Procedure • How Good Is The Layout?
Line Balancing Problem • Work stations are arranged so that the output of one is an input to the next, i.e., a series connection • Layout design involves assigning one or more of the tasks required to make a product to work stations • . . . more
Line Balancing Problem • The objective is to assign tasks to minimize the workers’ idle time, therefore idle time costs, and meet the required production rate for the line • In a perfectly balanced line, all workers would complete their assigned tasks at the same time (assuming they start their work simultaneously) • This would result in no idle time • . . . more
Line Balancing Problem • Unfortunately there are a number of conditions that prevent the achievement of a perfectly balanced line • The estimated times for tasks • The precedence relationships for the tasks • The combinatorial nature of the problem
Inputs • The production rate required from the product layout or the cycle time. • Cycle time is the maximum time allowed at each workstation tocomplete its set of tasks on a unit.The cycle time is the reciprocal of the production rate and visa versa. • All of the tasks required to make the product • It is assumed that these tasks can not be divided further • . . . more
Inputs • The estimated time to do each task • The precedence relationships between the tasks • These relationships are determined by the technical constraints imposed by the product • These relationships are displayed as a network known as a precedence diagram
0.1 min. 1.0 min. A Simple Precedence Diagram a b c d e 0.7 min. 0.5 min. 0.2 min. Precedence Diagram Precedence diagram: Tool used in line balancing to display elemental tasks and sequence requirements
Line Balancing Procedure • Determine which tasks must be performed to complete one unit of a product • Draw a precedence diagram which shows the sequence in which the tasks must be performed. • Estimate task times 4 Calculate the cycle time for the line. Remember the cycle time is the reciprocal of the production rate. Make sure the cycle time is expressed in the same time units as the estimated task times. . . . more
Line Balancing Procedure • Calculate the minimum number of workstations that can provide the required production rate. Cycle Time=Productive Time per hour / Demand per hour min # of workstations = Sum of all task times / Cycle Time 6. Use a line-balancing heuristic such as longest-task-time heuristic to assign tasks to workstations so that the production line is balanced.
Design Procedure 7. Open a new workstation with the full cycle time remaining. 8. Determine which tasks are feasible, i.e., can be assigned to this work station at this time. For a task to be feasible, two conditions must be met: • All tasks that precede that task must have already been assigned • The estimated task time must be less than or equal to the remaining cycle time for that work station.
Design Procedure Note that if there is only one feasible task, assign it to the work station. If there is more than one feasible task, use the heuristic (step 6) to determine which task to assign. Reduce the work station’s remaining cycle time by the selected task’s time. If there are no feasible tasks and assignments to that work station are complete, go back to step 7 (or stop, if all tasks have been assigned).
Longest-Task-Time Heuristic • Heuristic methods, based on simple rules, have been used to develop very good, not optimal, solutions to line balancing problems. • Longest-Task-Time Heuristic - adds tasks to a workstation one at a time in the order of task precedence, choosing - when a choice must be made - the task with the longest time.
How Good Is the Design? • Balance Efficiency is
Example 1: The ALB Problem • You’ve just been assigned the job a setting up an electric fan assembly line with the following tasks:
2 1 1 1.4 A B G H C D E F 3.25 1.2 .5 1 Example 1: The ALB Problem The Precedence Diagram • Which process step defines the maximum rate of production?
Example 1: The ALB ProblemWe want to assemble 100 fans per day What do these numbers represent?
Example 1: The ALB ProblemWe want to assemble 100 fans per day Why should we always round up?
Example 1: The ALB ProblemSelected Task Selection Rules • Primary:Assign tasks according to the largest number of following tasks. • Secondary (tie-breaking):Assign tasks in order of the longest operating time
2 1 1 1.4 A B G H C D E F 3.25 1.2 .5 1 Example 1: The ALB ProblemSelected Task Selection Rules Precedence Diagram
Task Followers Time (Min) A 6 2 2 1 1 C 4 3.25 1.4 A B G D 3 1.2 H 1 B 2 E 2 0.5 C D E F F 1 1 3.25 1.2 .5 1 G 1 1 H 0 1.4 Station 1 Station 2 Station 3 Slide 37 of 96
Task Followers Time (Min) A 6 2 2 1 1 C 4 3.25 1.4 A B G D 3 1.2 H 1 B 2 E 2 0.5 C D E F F 1 1 3.25 1.2 .5 1 G 1 1 H 0 1.4 Station 1 Station 2 Station 3 A (4.2-2=2.2) Slide 38 of 96
Task Followers Time (Min) A 6 2 2 1 1 C 4 3.25 1.4 A B G D 3 1.2 H 1 B 2 E 2 0.5 C D E F F 1 1 3.25 1.2 .5 1 G 1 1 H 0 1.4 Station 1 Station 2 Station 3 A (4.2-2=2.2) B (2.2-1=1.2) Slide 39 of 96
Task Followers Time (Min) A 6 2 2 1 1 C 4 3.25 1.4 A B G D 3 1.2 H 1 B 2 E 2 0.5 C D E F F 1 1 3.25 1.2 .5 1 G 1 1 H 0 1.4 Station 1 Station 2 Station 3 A (4.2-2=2.2) B (2.2-1=1.2) G (1.2-1= .2) Idle= .2 Slide 40 of 96
Task Followers Time (Min) A 6 2 2 1 1 C 4 3.25 1.4 A B G D 3 1.2 H 1 B 2 E 2 0.5 C D E F F 1 1 3.25 1.2 .5 1 G 1 1 H 0 1.4 Station 1 Station 2 Station 3 A (4.2-2=2.2) B (2.2-1=1.2) G (1.2-1= .2) Idle= .2 Slide 41 of 96
Task Followers Time (Min) A 6 2 2 1 1 C 4 3.25 1.4 A B G D 3 1.2 H 1 B 2 E 2 0.5 C D E F F 1 1 3.25 1.2 .5 1 G 1 1 H 0 1.4 Station 1 Station 2 Station 3 A (4.2-2=2.2) B (2.2-1=1.2) G (1.2-1= .2) Idle= .2 C (4.2-3.25)=.95 Idle = .95 Slide 42 of 96
Task Followers Time (Min) A 6 2 2 1 1 C 4 3.25 1.4 A B G D 3 1.2 H 1 B 2 E 2 0.5 C D E F F 1 1 3.25 1.2 .5 1 G 1 1 H 0 1.4 Station 1 Station 2 Station 3 A (4.2-2=2.2) B (2.2-1=1.2) G (1.2-1= .2) Idle= .2 C (4.2-3.25)=.95 Idle = .95 D (4.2-1.2)=3 Slide 43 of 96
Task Followers Time (Min) A 6 2 2 1 1 C 4 3.25 1.4 A B G D 3 1.2 H 1 B 2 E 2 0.5 C D E F F 1 1 3.25 1.2 .5 1 G 1 1 H 0 1.4 Station 1 Station 2 Station 3 A (4.2-2=2.2) B (2.2-1=1.2) G (1.2-1= .2) Idle= .2 C (4.2-3.25)=.95 Idle = .95 D (4.2-1.2)=3 Slide 44 of 96
Task Followers Time (Min) A 6 2 2 1 1 C 4 3.25 1.4 A B G D 3 1.2 H 1 B 2 E 2 0.5 C D E F F 1 1 3.25 1.2 .5 1 G 1 1 H 0 1.4 Station 1 Station 2 Station 3 A (4.2-2=2.2) B (2.2-1=1.2) G (1.2-1= .2) Idle= .2 C (4.2-3.25)=.95 Idle = .95 D (4.2-1.2)=3 E (3-.5)=2.5 Slide 45 of 96
Task Followers Time (Min) A 6 2 2 1 1 C 4 3.25 1.4 A B G D 3 1.2 H 1 B 2 E 2 0.5 C D E F F 1 1 3.25 1.2 .5 1 G 1 1 H 0 1.4 Station 1 Station 2 Station 3 A (4.2-2=2.2) B (2.2-1=1.2) G (1.2-1= .2) Idle= .2 C (4.2-3.25)=.95 Idle = .95 D (4.2-1.2)=3 E (3-.5)=2.5 F (2.5-1)=1.5 Slide 46 of 96
Task Followers Time (Min) A 6 2 2 1 1 C 4 3.25 1.4 A B G D 3 1.2 H 1 B 2 E 2 0.5 C D E F F 1 1 3.25 1.2 .5 1 G 1 1 H 0 1.4 Station 1 Station 2 Station 3 D (4.2-1.2)=3 E (3-.5)=2.5 F (2.5-1)=1.5 H (1.5-1.4)=.1 C (4.2-3.25)=.95 A (4.2-2=2.2) B (2.2-1=1.2) G (1.2-1= .2) Idle=.2 Idle=.95 Idle=.1 Slide 47 of 96
Example 1: The ALB Problem • Which station is the bottleneck? • What is the effective cycle time?