Download
1 / 1
10 likes | 194 Vues
P liquid. P gas. r. Relating Capillary Pressure to Interfacial Curvature Using a Two-dimensional Micromodel. Kendra I. Brown, Dorthe Wildenschild, and Mark L. Porter. H41F-0935. Department of Chemical, Biological and Environmental Engineering, Oregon State University, Corvallis, Oregon.

E N D
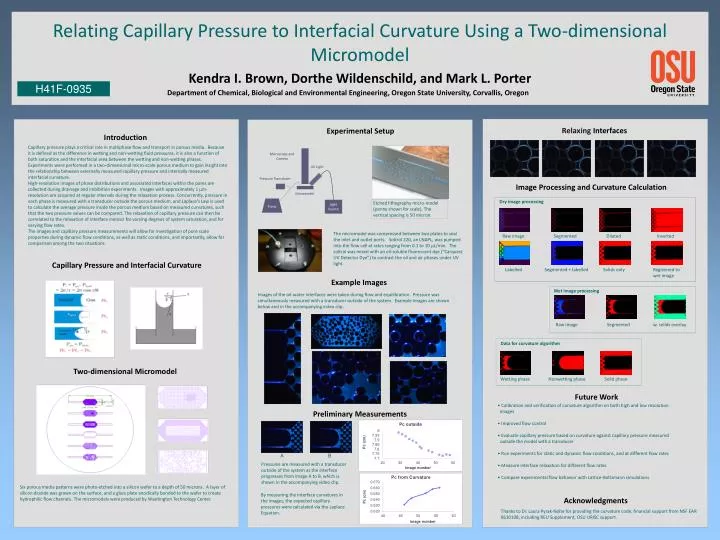
Pliquid Pgas r Relating Capillary Pressure to Interfacial Curvature Using a Two-dimensional Micromodel Kendra I. Brown, Dorthe Wildenschild, and Mark L. Porter H41F-0935 Department of Chemical, Biological and Environmental Engineering, Oregon State University, Corvallis, Oregon Relaxing Interfaces Experimental Setup Introduction Capillary pressure plays a critical role in multiphase flow and transport in porous media. Because it is defined as the difference in wetting and non-wetting fluid pressures, it is also a function of both saturation and the interfacial area between the wetting and non-wetting phases. Experiments were performed in a two-dimensional micro-scale porous medium to gain insight into the relationship between externally measured capillary pressure and internally measured interfacial curvature. High-resolution images of phase distributions and associated interfaces within the pores are collected during drainage and imbibition experiments. Images with approximately 1 μm-resolution are acquired at regular intervals during the relaxation process. Concurrently, pressure in each phase is measured with a transducer outside the porous medium, and Laplace’s Law is used to calculate the average pressure inside the porous medium based on measured curvatures, such that the two pressure values can be compared. The relaxation of capillary pressure can then be correlated to the relaxation of interface menisci for varying degrees of system saturation, and for varying flow rates. The images and capillary pressure measurements will allow for investigation of pore scale properties during dynamic flow conditions, as well as static conditions, and importantly, allow for comparison among the two situations. Microscope and Camera UV Light Pressure Transducer Image Processing and Curvature Calculation Micromodel Dry image processing Pump Light Source The micromodel was compressed between two plates to seal the inlet and outlet ports. Soltrol 220, an LNAPL, was pumped into the flow cell at rates ranging from 0.1 to 10 μL/min. The soltrol was mixed with an oil-soluble fluorescent dye (“Carquest UV Detector Dye”) to contrast the oil and air phases under UV light. Dilated Inverted Raw image Segmented Capillary Pressure and Interfacial Curvature Solids only Registered to wet image Labelled Segmented + labelled Example Images Wet image processing Images of the oil-water interfaces were taken during flow and equilibration. Pressure was simultaneously measured with a transducer outside of the system. Example images are shown below and in the accompanying video clip. Etched lithography micro-model (penny shown for scale). The vertical spacing is 50 micron. w. solids overlay Raw image Segmented Data for curvature algorithm Two-dimensional Micromodel Solid phase Wetting phase Nonwetting phase Future Work • Calibration and verification of curvature algorithm on both high and low resolution • images • Improved flow control • Evaluate capillary pressure based on curvature against capillary pressure measured • outside the model with a transducer • Run experiments for static and dynamic flow conditions, and at different flow rates • Measure interface relaxation for different flow rates • Compare experimental flow behavior with Lattice-Boltzmann simulations Preliminary Measurements A B Pressures are measured with a transducer outside of the system as the interface progresses from image A to B, which is shown in the accompanying video clip. Six porous media patterns were photo-etched into a silicon wafer to a depth of 50 microns. A layer of silicon dioxide was grown on the surface, and a glass plate anodically bonded to the wafer to create hydrophilic flow channels. The micromodels were produced by Washington Technology Center. By measuring the interface curvatures in the images, the expected capillary pressures were calculated via the Laplace Equation. Acknowledgments Thanks to Dr. Laura Pyrak-Nolte for providing the curvature code, financial support from NSF EAR 0610108, including REU Supplement, OSU URISC support.