Download
1 / 62
640 likes | 1.1k Vues
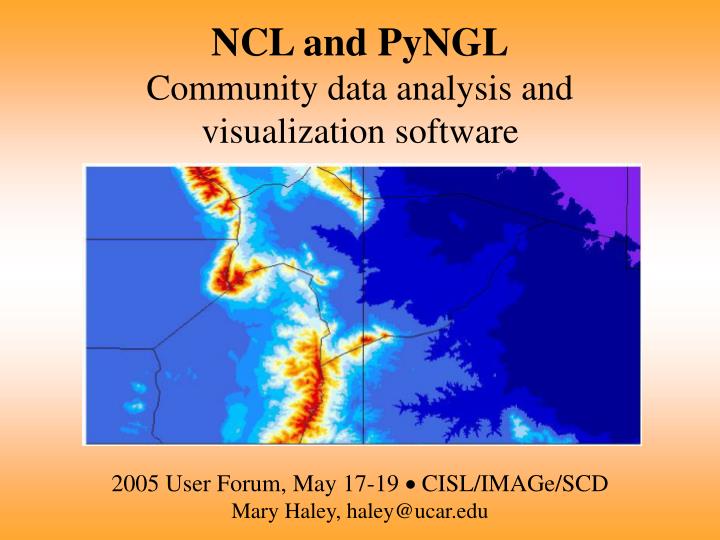
NCL and PyNGL Community data analysis and visualization software 2005 User Forum, May 17-19 CISL/IMAGe/SCD Mary Haley, haley@ucar.edu. Topics. NCAR Command Language Quick overview Workshop update What’s new Near future plans Python interface to NCL’s graphics library Introduction

E N D
NCL and PyNGLCommunity data analysis and visualization software2005 User Forum, May 17-19 CISL/IMAGe/SCD Mary Haley, haley@ucar.edu
Topics • NCAR Command Language • Quick overview • Workshop update • What’s new • Near future plans • Python interface to NCL’s graphics library • Introduction • Near future plans • Long range plans for NCL and PyNGL
NCL - Quick overview • An interpreted language designed for the analysis and visualization of data • Powerful in three areas: file I/O, data analysis, visualization • Runs on most UNIX systems, including MacOSX, LINUX, Windows/Cygwin • FREE
NCL overview: file I/O • Data model based on netCDF model • One function to read multiple data formats • Handles netCDF, GRIB-1, HDF4, HDF-EOS4, CCM History tape • GRIB reader one of the best • ASCII, binary Answer to question from yesterday: NCL supports NARR data and includes the NARR parameter table (NCEP parameter table 131).
NCL overview: data analysis • Over 800 functions • Spherical harmonics • Scalar and vector regridding • Vertical interpolation • EOFs • Many tailored to geosciences • Most handle missing data • Can call C and Fortran routines
NCL overview: visualization • High-quality visualizations • Contours, XY, vectors, streamlines, maps • Specialized scripts for skew-T, wind roses, histograms, panels, bar charts • GSUN interface: NCL scripts for simplifying visualization calls • Hundreds of plot options available
NCL strengths • Huge web-based example suite • NCL workshops • Consulting is knowledgeable and quick • Trivial to install, precompiled binaries • Enhancements based on user demand* * Get ready for the data analysis and visualization survey!
NCL workshops • 3 full-day classes with lectures and labs • Taught by CGD staff • 22 in the last 4 years: 15 in Boulder, rest off-site: • University of California at Santa Cruz • University of Alaska at Fairbanks • UCLA (twice) • Purdue • Naval Research Lab - Stennis Space Center • National Ocean Service - NOAA • Cancelled until further notice
What’s new • New NCL website • Command line options • Contouring on triangular meshes • NCL binaries on Earth System Grid • Enhancements to GRIB reader • Vis5D writer functions Online survey later this month
New NCL websitehttp://www.ncl.ucar.edu/ • Consolidates ngwww.ucar.edu and the www.cgd.ucar.edu graphics website • Function documentation in one location • “Applications” includes over 500 examples • Lots of documentation; printable manuals
Command line option preview • Predefined options (-V, -x, -P) • Can assign variables and execute commands: ncl i=1 x=3.14 ‘vars=(/“T”,“U”,“V”/)’ file.ncl • More options to come: byte-swapping control, printing control; would like to hear from you! http://www.ncl.ucar.edu/Document/Manuals/Ref_Manual/
Contouring on triangular meshes Dave Kennison and Dave Brown
New types of grids you can contour • Grids already on a triangular mesh • Grids represented by one-dimensional arrays of x, y, and z values • Grids with “cell boundary” information
To see some NCL examplesgo to:http://www.ncl.ucar.edu/Applications/and click on “Non-uniform grids”
NCL near future plans • CLOs - initial release • Revisiting our I/O module: HDF5, GRIB2, netCDF 4 coming up • Streamlines and vectors on a triangular mesh • Large file support, currently has same limitations as older versions of netCDF Did I mention the survey?
Sites that have downloaded and/or used NCLin the last few years
Department of Meteorology, Yugoslavia Nanjing University, China University of Michigan UCLA METRI/KMA, Korea Frontier Research System for Global Change, Japan Iowa State Hong Kong University of Science and Technology UCSD Czech Hydrometeorological Institute Osservatorio Meteorologico Regionale, Italy Institute for Atmospheric and Climate Science, Switzerland University of Reading, UK International Centre for Theoretical Physics, Italy NOAA-CIRES Climate Diagnostics Center Cooperative Institute for Mesoscale Meteorological Studies Woods Hole Oceanographic Institution Joint Program Department of Geology and Geophysics, Yale NOAA/NOS/Coast Survey Development Laboratory
Center for Ocean-Land-Atmosphere Studies Department of Physics (Atmospheric Physics), University of Toronto Universidade Federal da Bahia New Mexico Institute of Mining and Technology Pacific Northwest National Laboratory Atmospheric Science Division at LLNL Argonne National Lab University of Colorado Lawrence Berkeley National Lab University of Illinois NRL, Navy Climate Change & Impacts Laboratory, UCSC University of Washington University of Arizona Arctic Region Supercomputing Center, University of Alaska Center for Sustainability and the Global Environment, Univ of Wisconsin-Madison Fleet Numerical Meteorology and Oceanography Center Air pollution Section/Research Department, Norwegian Meteorological Institute Frontier Research System for Global Change, University of Alaska Fairbanks University of Virginia
University of Nevada Astronomy, Physics and Geophysics, University of Copenhagen Institute of Urban Meteorology, Beijing, China Scripps Institution of Oceanography, University of California CERFACS, France EMS Environment Institute, Penn State Centre Meteo UQAM Montreal, Montreal National Research Institute for Earth Science and Disaster Prevention, Japan University of L'Aquila, Department of Physics, Italy International Research Institute for Climate Prediction, Columbia University Alaska Experimental Forecast Facility Central Research Institute of Electric Power Industry, Japan National Severe Storms Laboratory Lamont-Doherty Earth Observatory, Columbia University, NY UBC Earth and Ocean Sciences, Canada Earth Tech, Concord, Massachusetts School of the Environment, Leeds University, UK Institute For Terrestrial and Planetary Atmospheres, State Univ of NY College of Oceanic and Atmospheric Sciences, Oregon State University Institute of Geophysics - Climatology, University of Bergen, Norway Institute for Geophysics, UT-Austin
University New South Wales Indonesia National Institute of Aeronautics and Space University of Nebraska Queensland Department of Natural Resources NC State University University of Costa Rica Louisiana State University MIT University College London Nagasaki University Deutscher Wetterdienst Institute of Atmospheric Physics, Chinese Academy of Sciences United Nations University YSA Corporation Chesapeake Research Consortium Naval Postgraduate School University of North Carolina at Chapel Hill Research Center for Environmental Changes, Taiwan IMAQS, U. of Houston Pusan national University, Korea University of Victoria, British Columdia, Canada
Institute of Oceanology, Russia Rudjer Boskovic Institute, Croatia Mississippi State University Advanced Environment Monitoring Research Center, Korea Kyushu University, Korea University of Northern British Columbia Korea Meteorological Administration International Pacific Research Center/School of Ocean and Earth Science, Hawaii German Weather Service University of Waterloo Comalco Aluminium Ltd, New Zealand Altai State University, Russia University of Maine IQAFF, Quebec Kinetica Analysis Corporation/University of Central Florida Centre for Mathematical Modelling and Computer Simulation, India University of British Columbia Howard University Universidad del Pais Vasco Indian Institute of Science University of Delaware
Princeton Central Weather Bureau of Taiwan Seoul National University, Korea CNR-Venice-Italy Weathernews Americas Inc. Mephise Technology (Taiwan) Purdue University Ohio State University USDA Forest Service International Arctic Research Center California Air Resources Board U.A.E. Air Force Air Defense University of Nebraska CWB (Center for Wooden Boats? Central Weather Bureau? Canadian Wheat Board?) GFDL/NOAA Chung-Cheng Institute of Technology National Renewable Energy Lab Zhejiang Climate Center, Beijing University of Texas at Austin Wageningen University, Netherlands
University of Athens Macao Meteorological Bureau, Hong Kong Duke University Texas A&M University SD School of Mines Department of Marine, Earth and Atmospheric Sciences, NCSU Universidad Politecnica de Catalunya, Spain National Taiwan University University of Pecs, Hungary Kobe University, Japan University of Tartu, Estonia UC, Irvine Institute of Meteorology, University of Edinburgh San Francisco State University University of Kentucky College of Resources Science and Technology, Beijing Normal University Meteo-France Agromet LS Cable Ltd., chiller development Potsdam Institute for Climate Impact Research, Germany ARPA Piemonte, Italy
USDA Animal Improvement Programs Laboratory Marine Meteorological Observation and Investigation Drexel University Indian Institute of Technology, Delhi Caltech Abu Dhabi International Airport Meteorological Office Michigan Tech University SongXiaoya University Yonsei University, Seoul, Korea Jackson State University Climate Research, Tokyo University
Python interface toNCL’s Graphics Library(PyNGL)Fred Clare and Mary Haley http://www.pyngl.ucar.edu/
What is Python? An interpreted, interactive, object-oriented programming language often comparedwith Perl, Tcl, and Java.
Python strengths • Open source and portable • Full object oriented capabilities • Well documented and easy to learn • Modular • Toolkits for building GUIs - Tkinter • 3D visualization - vtk, OpenGL • Extendable with C/C++ and Fortran • Large and rapidly growing user base
Python strengths: lots of existing code • PyTables - HDF5 reader • PIL - Python Imaging Library • Libraries of scientific tools • netCDF module • FFTPACK, SPHEREPACK, LAPACK • PyGlobus - toolkit for GRID computing
Why a Python interface? • Demand for high-quality 2D visualizations • Mainstream language - wider audience • Open source • Collaboration opportunities • Capitalize on the work of others • Contribution to Python community
Introduction to PyNGL • Modeled after popular GSUN interface • Same 2D publication-quality graphics as NCL • Multiple output formats - same as NCL • Extensive documentation • Line-by-line explanation of examples
PyNGL NCL/GSUN import Ngl from Scientific.IO.NetCDF import * # Open the NetCDF file. nf = NetCDFFile("meccatemp.cdf","r") # Get lat/lon/temperature variables. lat = nf.variables["lat"][:] lon = nf.variables["lon"][:] T = nf.variables["t"][0,:,:] # Open a PS workstation. wks = Ngl.open_wks("ps","mecca") # Contour & scalar field resources. res = Ngl.Resources() res.sfXArray = lon res.sfYArray = lat res.cnFillOn = True # Draw contour plot. contour = Ngl.contour(wks,T,res) Ngl.end() load "gsn_code.ncl" begin ; Open the NetCDF file. nf = addfile("meccatemp.cdf","r") ; Get lat/lon/temperature variables. lat = nf->lat lon = nf->lon T = nf->t(0,:,:) ; Open a PS workstation. wks = gsn_open_wks("ps","mecca") ; Contour & scalar field resources. res = True res@sfXArray = lon res@sfYArray = lat res@cnFillOn = True res@lbPerimOn = False ; Draw contour plot. contour = gsn_contour(wks,T,res) end