Download
1 / 77
780 likes | 965 Vues
i247: Information Visualization and Presentation Marti Hearst. April 7, 2008. Search and Text Visualization. Nominal data is hard to visualize Goals of search vs. text analysis What works well for each?. When people are searching … . Search + Viz Meta-Analysis. Chen & Yu 2000

E N D
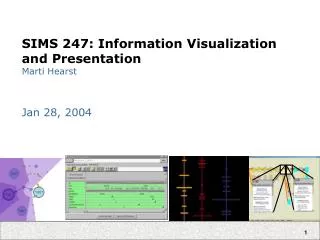
i247: Information Visualization and PresentationMarti Hearst April 7, 2008
Search and Text Visualization • Nominal data is hard to visualize • Goals of search vs. text analysis • What works well for each?
Search + Viz Meta-Analysis • Chen & Yu 2000 • Individual cognitive differences among participants had the largest effect, especially on accuracy, and to some degree on efficiency, • Holding cognitive abilities constant, participants performed better with simpler visual-spatial interfaces than with complex ones, and • The combined effect of visualization in the studies was not statistically significant.
Query Term Visualization • Fancy Boolean viz’s are better than boolean command lines but still not used • Term suggestions arranged as a cloud can be liked, but unlikely to be better than a simple list of term suggestions
Search Results Visualization • Show location of term hits within retrieved documents • TileBars was first • There have been many variations since
TileBars: Viewing Retrieval Results Goal: minimize time/effort for deciding which documents to examine in detail Idea: show the roles of the query terms in the retrieved documents, making use of document structure
Exploiting Visual Properties • Variation in gray scale saturation imposes a universal, perceptual order (Bertin et al. ‘83) • Varying shades of gray show varying quantities better than color (Tufte ‘83) • Differences in shading should align with the values being presented (Kosslyn et al. ‘83)
Other Variations • HotMaps, Hoeber & Yang, Pie Charts, Anderson et al.
A Comparative Study • Reiterer et al., SIGIR 2000 • Well-done study • They weren’t the creators of the viz’s tested • 40 participants, varied tasks • Compared: • Plain html web page • Sortable search results (in a table view) • Tilebars-like view • Bar charts view • Scatterplot view • Results: • People weren’t any better with viz’s than with standard web view. Significantly worse with bar charts • Subjective results: Sortable Table, then Tilebars, then simple web-based view • People hated bar charts and scatter plots
Cluster-based Grouping Document Self-similarity (Polythetic)
Scatter/Gather Clustering • Developed at PARC in the late 80’s/early 90’s • Top-down approach • Start with k seeds (documents) to represent k clusters • Each document assigned to the cluster with the most similar seeds • To choose the seeds: • Cluster in a bottom-up manner • Hierarchical agglomerative clustering • Can recluster a cluster to produce a hierarchy of clusters Pedersen, Cutting, Karger, Tukey, Scatter/Gather: A Cluster-based Approach to Browsing Large Document Collections, SIGIR 1992
Two Queries: Two Clusterings AUTO, CAR, ELECTRIC AUTO, CAR, SAFETY 8control drive accident … 25 battery california technology … 48 import j. rate honda toyota … 16 export international unit japan 3 service employee automatic … 6control inventory integrate … 10 investigation washington … 12 study fuel death bag air … 61 sale domestic truck import … 11 japan export defect unite … The main differences are the clusters that are central to the query
Scatter/Gather Evaluations • Can be slower to find answers than linear search! • Difficult to understand the clusters. • There is no consistence in results. • However, the clusters do group relevant documents together. • Participants noted that useful for eliminating irrelevant groups.
Visualizing Clustering Results • Use clustering to map the entire huge multidimensional document space into a huge number of small clusters. • User dimension reduction and then project these onto a 2D/3D graphical representation
Are visual clusters useful? • Four Clustering Visualization Usability Studies • Conclusions: • Huge 2D maps may be inappropriate focus for information retrieval • cannot see what the documents are about • space is difficult to browse for IR purposes • (tough to visualize abstract concepts) • Perhaps more suited for pattern discovery and gist-like overviews.
Clustering for Search Study 1 • This study compared • a system with 2D graphical clusters • a system with 3D graphical clusters • a system that shows textual clusters • Novice users • Only textual clusters were helpful (and they were difficult to use well) Kleiboemer, Lazear, and Pedersen. Tailoring a retrieval system for naive users. SDAIR’96
Clustering Study 2: Kohonen Feature Maps, Chen et al. • Comparison: Kohonen Map and Yahoo • Task: • “Window shop” for interesting home page • Repeat with other interface • Results: • Starting with map could repeat in Yahoo (8/11) • Starting with Yahoo unable to repeat in map (2/14) Chen, Houston, Sewell, Schatz, Internet Browsing and Searching: User Evaluations of Category Map and Concept Space Techniques. JASIS 49(7): 582-603 (1998)
Study 2 (cont.), Chen et al. • Participants liked: • Correspondence of region size to # documents • Overview (but also wanted zoom) • Ease of jumping from one topic to another • Multiple routes to topics • Use of category and subcategory labels Chen, Houston, Sewell, Schatz, Internet Browsing and Searching: User Evaluations of Category Map and Concept Space Techniques. JASIS 49(7): 582-603 (1998)
Study 2 (cont.), Chen et al. • Participants wanted: • hierarchical organization • other ordering of concepts (alphabetical) • integration of browsing and search • correspondence of color to meaning • more meaningful labels • labels at same level of abstraction • fit more labels in the given space • combined keyword and category search • multiple category assignment (sports+entertain) • (These can all be addressed with faceted categories) Chen, Houston, Sewell, Schatz, Internet Browsing and Searching: User Evaluations of Category Map and Concept Space Techniques. JASIS 49(7): 582-603 (1998)
Clustering Study 3: Sebrechts et al. Each rectangle is a cluster. Larger clusters closer to the “pole”. Similar clusters near one another. Opening a cluster causes a projection that shows the titles.
Study 3, Sebrechts et al. This study compared: • 3D graphical clusters • 2D graphical clusters • textual clusters • 15 participants, between-subject design • Tasks • Locate a particular document • Locate and mark a particular document • Locate a previously marked document • Locate all clusters that discuss some topic • List more frequently represented topics Visualization of search results: a comparative evaluation of text, 2D, and 3D interfaces Sebrechts, Cugini, Laskowski, Vasilakis and Miller, SIGIR ‘99.
Study 3, Sebrechts et al. • Results (time to locate targets) • Text clusters fastest • 2D next • 3D last • With practice (6 sessions) 2D neared text results; 3D still slower • Computer experts were just as fast with 3D • Certain tasks equally fast with 2D & text • Find particular cluster • Find an already-marked document • But anything involving text (e.g., find title) much faster with text. • Spatial location rotated, so users lost context • Helpful viz features • Color coding (helped text too) • Relative vertical locations
Clustering Study 4 • Compared several factors • Findings: • Topic effects dominate (this is a common finding) • Strong difference in results based on spatial ability • No difference between librarians and other people • No evidence of usefulness for the cluster visualization Aspect windows, 3-D visualizations, and indirect comparisons of information retrieval systems, Swan, &Allan, SIGIR 1998.
Summary:Visualizing for Search Using Clusters • Huge 2D maps may be inappropriate focus for information retrieval • cannot see what the documents are about • space is difficult to browse for IR purposes • (tough to visualize abstract concepts) • Perhaps more suited for pattern discovery and gist-like overviews.
Clustering Algorithm Problems • Doesn’t work well if data is too homogenous or too heterogeneous • Often is difficult to interpret quickly • Automatically generated labels are unintuitive and occur at different levels of description • Often the top-level can be ok, but the subsequent levels are very poor • Need a better way to handle items that fall into more than one cluster
Term-based Grouping Single Term from Document Characterizes the Group (Monothetic)
Findex, Kaki & Aula • Two innovations: • Used very simple method to create the groupings, so that it is not opaque to users • Based on frequent keywords • Doc is in category if it contains the keyword • Allows docs to appear in multiple categories • Did a naturalistic, longitudinal study of use • Analyzed the results in interesting ways • Kaki and Aula: “Findex: Search Result Categories Help Users when Document Ranking Fails”, CHI ‘05
Study Design • 16 academics • 8F, 8M • No CS • Frequent searchers • 2 months of use • Special Log • 3099 queries issued • 3232 results accessed • Two questionnaires (at start and end) • Google as search engine; rank order retained
Kaki & Aula Key Findings (all significant) • Category use takes almost 2 times longer than linear • First doc selected in 24.4 sec vs 13.7 sec • No difference in average number of docs opened per search (1.05 vs. 1.04) • However, when categories used, users select >1 doc in 28.6% of the queries (vs 13.6%) • Num of searches without 0 result selections is lower when the categories are used • Median position of selected doc when: • Using categories: 22 (sd=38) • Just ranking: 2 (sd=8.6)
Kaki & Aula Key Findings • Category Selections • 1915 categories selections in 817 searches • Used in 26.4% of the searches • During the last 4 weeks of use, the proportion of searches using categories stayed above the average (27-39%) • When categories used, selected 2.3 cats on average • Labels of selected cats used 1.9 words on average (average in general was 1.4 words) • Out of 15 cats (default): • First quartile at 2nd cat • Median at 5th • Third quartile at 9th