Download
1 / 10
100 likes | 365 Vues
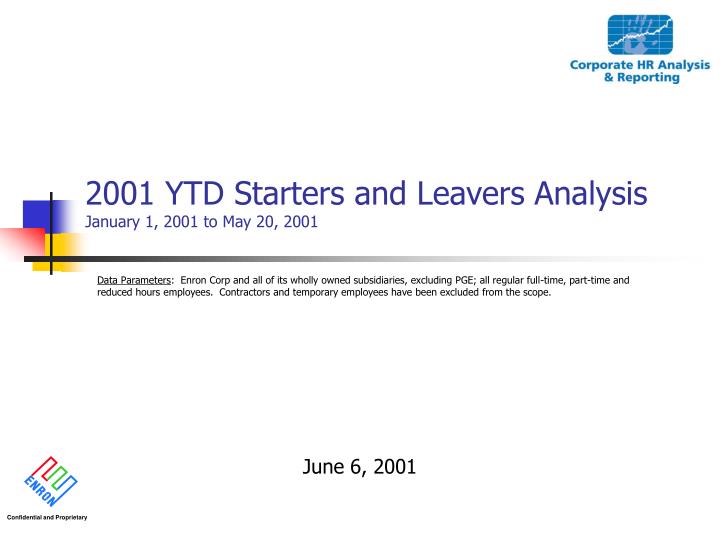
2001 YTD Starters and Leavers Analysis January 1, 2001 to May 20, 2001. Data Parameters : Enron Corp and all of its wholly owned subsidiaries, excluding PGE; all regular full-time, part-time and reduced hours employees. Contractors and temporary employees have been excluded from the scope.

E N D
2001 YTD Starters and Leavers AnalysisJanuary 1, 2001 to May 20, 2001 Data Parameters: Enron Corp and all of its wholly owned subsidiaries, excluding PGE; all regular full-time, part-time and reduced hours employees. Contractors and temporary employees have been excluded from the scope. June 6, 2001 Confidential and Proprietary
Executive Summary • YTD Overall Separations and Net Job Growth (1/1/01 to 5/20/01) • The gap between contribution loss and separation rate has been narrowing, indicating that good performers have been leaving Enron • more in recent week.s. • Net job growth from 1/1/01 to present = 593 (1,910 new hires less 1,317 separations). This equates to an 8.5% annualized net growth • rate for 2001 YTD. EWS showed the largest net growth (470 employees), with an annualized net growth rate of 15.0% for 2001 YTD. • Annualized overall separation rate = 18.7% (1,317 separations) • Contribution loss (separations weighted by performance ratings) is 13.5% in total, indicating that Enron is losing more poor performers • than high performers. • - 19.1% (252) of separated employees were rated Needs Improvement or Issues • Business Reorganization (414 employees or 31.4%) and Personal Reasons (323 employees or 24.5%) are top reasons for separation • YTD Voluntary Separations (1/1/01 to 5/20/01) • Annualized voluntary separation rate = 8.8% (620 separations), an increase from the 6% reported in Fortune’s survey published in • January 2001. • Major Reason: Personal Reasons - 52.1% or 323 separations • 33.8% (109) in EEL; 20.7% (67) in EES • Major Business Unit: EEL - 22.6% or 140 separations • 77.9% (109) stated Personal Reasons as driver • Left to Join Competitor: 10.8% or 67 separations • 17.9% (12) in EES; 14.9% (10) in EBS • Currently unable to report on companies for which employees leave Enron; initiative should be undertaken to capture this. • Contribution loss rate of 8.3% is < 8.8% separation rate, indicating that Enron is losing more poor performers than high performers; • however, the gap between contribution loss and separation rate has been narrowing recently, indicating that good performers have • been leaving Enron, especially in EBS. • YTD Involuntary Separations (1/1/01 to 5/20/01) • Annualized involuntary separation rate = 9.9% (697 separations) • 59.4% (414) of all involuntary separation has resulted from Business Reorganization, primarily occurring in EBS, EES, ESA and India. • 166 of 414 (40.1%) of employees separated for this reason were rated Strong, Excellent or Superior. Contribution Loss rate for all • Business Reorganization is 5.4% vs. a separation rate of 5.9%, indicating that overall, Enron has lost more poor performers than high • performers due to Business Reorganization. • 11.2% (78) of involuntary separations are due to Unsatisfactory Performance, 18.0% of which occurred in ENA • Contribution loss rate of 5.2% is < 9.9% separation rate, indicating that Enron is not losing high performers
Net Change in Employee Countby Business Unit Annualized Net Growth Rate by Business Unit Corp: -5.9% EBS: -31.5% EES: 6.7% ETS: 14.1% EWS: 15.0%
Separation Rates • 2001 YTD Separations: • Voluntary separations, especially those due to Personal • Reasons, have steadily increased since the beginning of the year. • While the voluntary separation rate still exceeds voluntary • contribution loss, the gap has narrowed from 4.3% at the • beginning of February to 0.5% in the most recent week, indicating • that Enron is losing good performers at an increasing rate. • In the two weeks following the announcement of bonuses, 50 • rated (and 26 un-rated) employees separated; 72% (36) of rated • employees were Satisfactory or above. • Involuntary separations continue to outpace voluntary • separations. Business Reorganization, Reduction in Force and • Discontinuation of Position compose 74.5% of all involuntary • separations.Separations due to these reasons occurred • primarily in EBS, EES, ESA and India.Annualized • YTD contribution loss due to Business Reorganization exceeded • separation rate in ESA and EES indicating that more good • performers than poor performers were severed due to Business • Reorganization. • Cumulative annualized involuntary contribution loss is 5.2% vs. a • separation rate of 9.9%. Total Involuntary contribution loss stood • at -2.3% in early February while the separation rate was 9.1%. Benchmarking Data CompanyVoluntary Separation (1999) Microsoft 10% Intel 6% Sun Microsystems 6% Goldman Sachs 11% Eli Lilly 3% Enron 6% Saratoga InstituteVoluntary Separation (2000) Non-Bank Financial 19% 10,001 to 25,000 emps 14% Central U.S. 15% Separation numbers include all Enron wholly-owned subsidiaries, excluding contractors and temporary employees.
Contribution Loss All separation and contribution loss rates are annualized 2001 YTD Voluntary Separations Contribution DateSeparation RateLossTotal Quarter 1 9.3% 8.0% 419 Quarter 2 Apr 2-Apr 8 8.2% 4.1% 29 Apr 9-Apr 15 8.2% 12.1% 32 Apr 16-Apr 22 6.2% 6.9% 22 Apr 23-Apr 29 4.5% 6.0% 16 Apr 30-May 6 14.8% 6.0% 53 May 7-May 13 3.9% 5.6% 14 May 14-May 20 9.8%14.4%35 Subtotal 7.8% 8.9% 201 YTD 8.8% 8.3% 620 Contribution loss rate is lower than both voluntary and involuntary separations, indicating that Enron is losing poor vs. good performers. However, it should be noted the gap between contribution loss and separation rate is narrowing. In fact, voluntarycontribution loss exceeded the separation rate during the weeks of 2/5, 2/19, 2/26, 3/12, 3/19, 3/26, 4/9, 4/16, 4/23, 5/7 and 5/14, indicating Enron lost slightly more good performers than poor performers during this time. Bonuses Paid Contribution Loss Scale* PRC RatingWeight 1 - Superior 3 2 - Excellent 2.5 3 - Strong 2 0 - No Rating 1 4 - Satisfactory 1 5 - Needs Improvement -2 6 - Issues -3 2001 YTD Involuntary Separations Contribution DateSeparation RateLossTotal Quarter 1 10.5% 3.3% 482 Quarter 2 Apr 2-Apr 8 3.4% 11.0% 12 Apr 9-Apr 15 0.8% 4.2% 38 Apr 16-Apr 22 0.8% 0.0% 3 Apr 23-Apr 29 2.8% -0.1% 10 Apr 30-May 6 11.8% -0.1% 42 May 7-May 13 18.4% 26.0% 66 May 14-May 20 12.3%20.7%44 Subtotal 8.4% 9.4% 215 YTD 9.9% 5.2% 697 Bonuses Paid *A new Contribution Loss Scale is being developed to accommodate the new PRC rating scale. Commercial Separations Job FunctionInvoluntaryVoluntary Acct Mgmt 5 1 Anal/Assoc 12 30 Asset Devel 13 4 Corp Devel 4 2 E-Commerce 3 2 Finance 4 5 Operations 1 0 Origination 62 28 Risk Mgmt 1 6 Structuring 15 5 Trading 6 12 Underwriting 10 Total 127 95 2001 YTD Commercial Separations Contribution Separation RateLossTotal Involuntary 1.8% 0.4% 127 Voluntary 1.3%1.9%95 Total 3.1% 2.3% 222 In the past 60 days, 58% of voluntary commercial separations were rated Strong or above. 79% of commercial employees separating in the past 30 days were rated Strong or above.
Separations by Job Function and JobGroup with PRC Ratings Note: Job Function excludes 24 involuntary and 34 voluntary N/A job functions; Job Group excludes 55 involuntary and 90 voluntary N/A job groups.
Separations by Work Location Involuntary Terminations Domestic Houston 274 Portland 58 Pleasanton, CA 41 Wheatland, IN 12 Other 49 Total 434 Non-U.S. India 72 UK 62 Brazil 50 Argentina 20 Other 59 Total 263 Voluntary Terminations Domestic Houston 288 Garfield, NJ 10 Omaha 10 Tehachapi, CA 9 Other 75 Total 392 Non-U.S. UK 157 Brazil 13 Canada 13 India 11 Other 34 Total 228
Currently Active Employees WhoWere Rated in 2000 Year-End PRC* * Includes employees in Enron Corp and its wholly-owned subsidiaries