Download
1 / 6
60 likes | 173 Vues
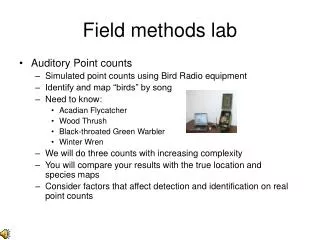
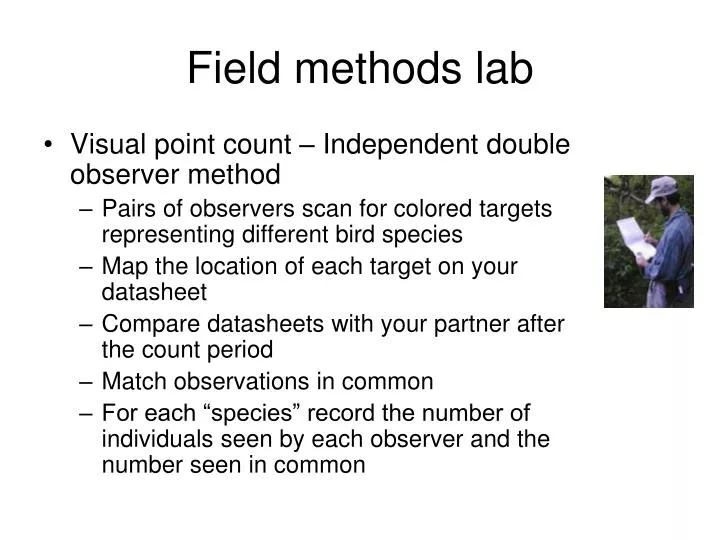
Field methods lab. Visual point count – Independent double observer method Pairs of observers scan for colored targets representing different bird species Map the location of each target on your datasheet Compare datasheets with your partner after the count period Match observations in common

E N D
Field methods lab • Visual point count – Independent double observer method • Pairs of observers scan for colored targets representing different bird species • Map the location of each target on your datasheet • Compare datasheets with your partner after the count period • Match observations in common • For each “species” record the number of individuals seen by each observer and the number seen in common
4 Species: • Small Red = SR • Large Red = LR • Small Brown = SB • Large Brown = LB SR LR SB SR LB LB
Field methods lab • Data Summary • Each pair of observers will summarize their double observer data on the data sheets provided and email them to the TA as an Excel file by the end of day on Friday • For each “species” in each habitat • n1 (number of individuals seen by the first observer) • n2 (number of individuals seen by the second observer) • m2 (number of individuals seen in common) • The TA will compile the data and post it online with an Excel worksheet • Use the Lincoln-Petersen equations in the worksheet to estimate population size and detection probability for each “species” in each habitat
Field methods lab n1 = number of individuals seen by the first observer n2 = number of individuals seen by the second observer m2 = number of individuals seen by both observers N = estimated population size V(N) = variance of N p1 = detection probability for observer 1 p2 = detection probability for observer 2
Field methods lab • Write-up • A summary of your results, including average population estimate and detection probability for each species from each habitat • A comparison of your results to the true results, as well as to other members of the class • A discussion of the factors that affected your ability to detect "birds" on visual counts • Your thoughts about other factors that may affect detection probabilities on real point counts • ~ 1-2 pages