Download
1 / 16
160 likes | 170 Vues
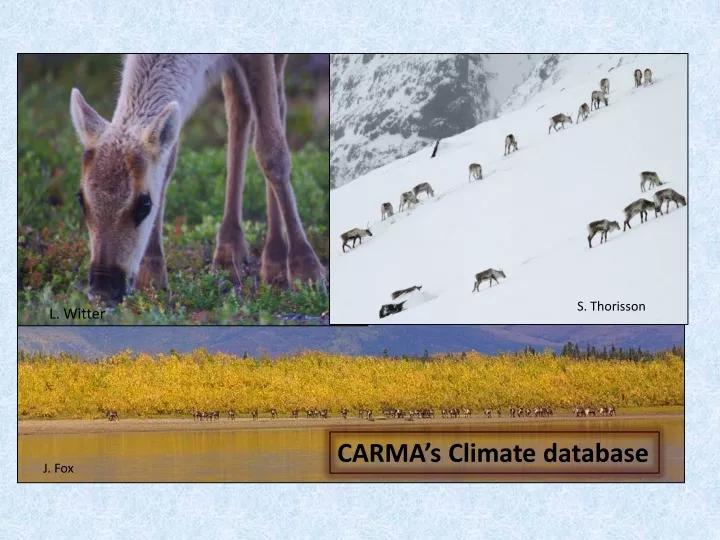
S. Thorisson. L. Witter. CARMA’s Climate database. J. Fox. Why a CARMA climate database. CARMA’s goal to monitor and assess impacts of global change on caribou Major approach is cross-herd comparisons

E N D
S. Thorisson L. Witter CARMA’s Climate database J. Fox
Why a CARMA climate database • CARMA’s goal to monitor and assess impacts of global change on caribou • Major approach is cross-herd comparisons • Need to compare (how are herd habitats similar) and contrast (how are herd habitats different) • Climate plays a central role in controlling caribou abundance and distribution • Ideal to have one source for the data – climate data
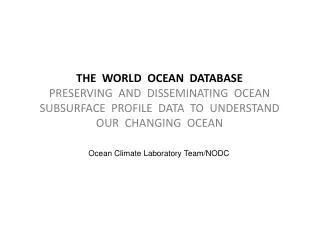
1979 – 2010 daily data available for over 100 variables across the circumpolar north
…a few words about MERRA data • Universal coverage for over the last 30 years • Brings together all climate data within the satellite era • Ensures that different satellite provide a consistent measure of the environment • Data at least daily and, for example temperature, every 3 hours • 72 variables offered • Grid size ½ degree latitude by 2/3 degree longitude • Data is available to download within months • Estimate for CARMA to provide annual updates is ~ 18 hours – of which 15 hours is for MERRA data download
8 polygons per herd for example – Bluenose West Herd summer calving tundra fall taiga winter spring whole herd
2 types of tables created Seasonal range tables Caribou movement tables calving calving summer summer winter winter fall fall 104 grids PCH winter 219 grids Taimyr winter
Caribou-relevant climate derivatives winter spring/calving autumn summer autumn
…a few examples:comparing years for a herd (summer temperature)
How much data? • MERRA raw data 21.5 Gbytes • Polygon focused tables 2.1 Gbytes • Caribou focused tables 138 Mbytes • TOTAL ~ 25 GBytes
Some questions for the breakout • Data quality? – Greenness Index, Leaf Area Index • validation • Documentation needs? • Access? • Additional caribou related variables? • Are there basic summaries needed? • Trend analysis? • Tele-connections? • Update schedule – annual, timing?