Download
1 / 12
120 likes | 316 Vues
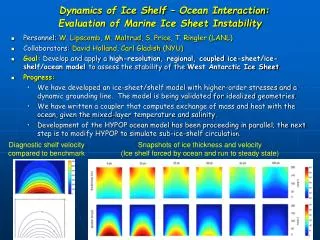
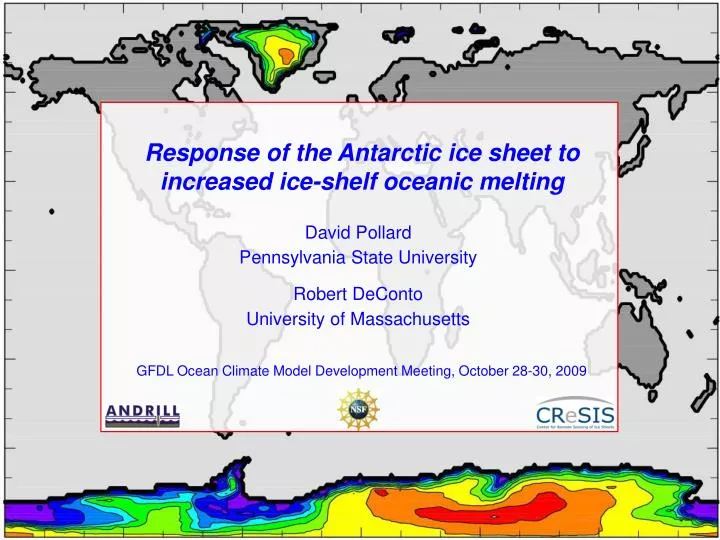
Response of the Antarctic ice sheet to increased ice-shelf oceanic melting. David Pollard Pennsylvania State University Robert DeConto University of Massachusetts. GFDL Ocean Climate Model Development Meeting, October 28-30, 2009. Ice velocities across the grounding line…

E N D
Response of the Antarctic ice sheet to increased ice-shelf oceanic melting David Pollard Pennsylvania State University Robert DeConto University of Massachusetts GFDL Ocean Climate Model Development Meeting, October 28-30, 2009
Ice velocities across the grounding line… - are slowed by ice-shelf buttressing - increase strongly with g.l. depth • So, if ice-shelf buttressing is lost, and the bed deepens upstream...then possibility of runaway retreat ! ice interior grounding line retreat Weertman (1976, Nature); Mercer (1978, Nature); Schoof (2007, JGR) B A ? B in 100 years? A B in 1000+ years? B Grounding-Line Retreat Instability Ronne Ice Shelf Pine Island & Thwaites glaciers Ross Ice Shelf
Outline 1. 3-D ice sheet-shelf model 2. Last 5 Myr, vs. ANDRILL record 3. Same model run into future O(103) years -Prescribed sub-ice-shelf oceanic melting WAIS retreat? - Other variations added
Features in ice sheet-shelf model qg qg ice ocean bed Predicts ice thickness, temperature, bedrock elevation. 40 km grid size. Follows standard model lineage… PLUS: • Hybrid combination of the 2 scaled equations for shearing (grounded interior) and stretching (floating/stream) ice flow • C. Schoof’s (2007,JGR) parameterization of flux across grounding lines (qg). Allows realistic grounding-line migration and ice-shelf buttressing • Simple parameterizations of forcings: - sea level - surface mass balance and temperature - sub-ice-shelf oceanic melt rate
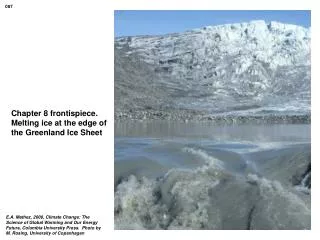
ANtarctic geological DRILLing program • WAIS has been dynamic, advancing and retreating on ~40 kyr obliquity cycles • Long-term trends: • - Modern glacials, 1 to 0 Ma • - Cooling transition, 3 to 1.5 Ma • - Warmest in early Pliocene, • extended interglacials, 5 to • 3.5 Ma Main Results Depth (mbsf) Approx. Age (Ma) 0 1 2 ANDRILL MIS 3 4 5 MIS core, upper 600m (last ~5 Myr) Naish et al., Nature, 2009 photo: C. Millan Yellow = diatomite (open ocean) Green = glacial till (grounded ice) Grey = mud/silt/sand (ice nearby) Orange = volcanic
FORCING: benthic 18O Glacial maxima Lisiecki and Raymo, Paleoceanogr., 2005 MODEL OUTPUT: total Antarctic ice volume pink = floating ice shelves ~Modern MODEL OUTPUT: total Antarctic ice volume Pollard and DeConto, Nature, 2009 Pleistocene WAIS collapses Super-Interglacials Naish et al., Nature, 2009 ANDRILL MIS core: Closest model grid point and ANDRILL core agree: • ~5 to 3 Ma: Long periods with open ocean • ~3 to 1 Ma: Cooling trend • ~1 to 0 Ma: Current glacial cycles Model Antarctic ice volume, last 5 million years
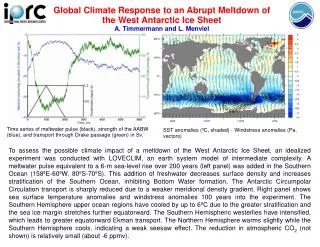
Sub-ice-shelf oceanic melt – most important future forcing Sources of sub-ice-shelf water depend on larger-scale circulation –(Circumpolar Deep Water CDW, and High Salinity Shelf Water HSSW) Circulation under ice shelves is an active research area with Regional Ocean Models – (Dinniman, Galton-Fenzi, Hollands, Jenkins, Makinson, Little, Walker, et al!) Beckmann and Goosse, Ocn. Model., 2003
2 m y-1 x 0.4 m y-1/ oC A-OGCM future warming x “empirical” coefficient: Modern ocean melt rates = [.1,5,5], where .1 = protected shelf (most important) 5 = exposed shelf 5 = deep ocean areas sub-ice melt increase per nearby ocean T, for large shelves (Beckmann and Goose, 2003) Overpeck et al., Science, 2006. Ocean T, 100m and 200 m, 2100 and 2130 AD For now, we simply prescribe sudden increases in oceanic melt rates, from modern [.1,5,5] m/yr …but to what?
Nested domain over West Antarctica Continental Antarctica, 20 km grid Nested WAIS, 10 km grid
0 yr 300 or 3000 yr? • Given plausible future increases in sub-ice-shelf ocean melting, central WAIS is likely to collapse • Time scale of collapse depends on magnitude of sub-ice ocean melt: - 2 m/yr ~3000 years, m/yr ~300 years - What future melt rates for the major ice shelves? … Will need Regional Ocean Models and GCMs for projections. … Different rates for different embayments? ~40 m/yr for PIG-THG! • Test with next generation higher-order higher-resolution ice models! Large melt rates are already observed under smaller shelves! Rignot and Jacobs, Science, 2002 Future WAIS summary