Download

1 / 22
230 likes | 392 Vues
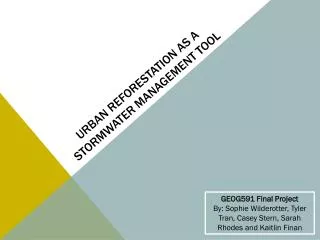
Urban Reforestation as a stormwater management tool. GEOG591 Final Project By: Sophie Wilderotter , Tyler Tran, Casey Stern, Sarah Rhodes and Kaitlin Finan. introduction. Negative Impacts of Urbanization and Impervious C over:

E N D
Urban Reforestation as a stormwater management tool GEOG591 Final Project By: Sophie Wilderotter, Tyler Tran, Casey Stern, Sarah Rhodes and Kaitlin Finan
introduction • Negative Impacts of Urbanization and Impervious Cover: • Physical impacts: Increased velocity /volume of runoff, Flooding, Erosion of Stream Banks, Decline in Infiltration and Groundwater Recharge, Degradation of Riparian Zones • Ecological Impacts: Contamination of water bodies by non-point source pollution can cause stress for aquatic organisms such as: hypoxia by nutrients (N &P), pathogen contamination of shellfish beds, physiological effects by toxic chemicals • (Arnold and Gibbons, 1996)
A storm-water Management tool: Reforestation • Increased evapotranspiration • Reduced runoff • Potential tool for Carbon sequestration
Study objectives • Quantify and characterize the tree cover, including the life form, extent of trees and LAI, in Chapel Hill and Carrboro, NC • Determine suitable regions for reforestation in Chapel Hill and Carrboro alongside roadways and sidewalks and areas of low LAI • Estimate the water balance change that would result from increasing tree cover in this region.
Study Area • Municipalities of Chapel Hill and Carrboro combined • 77.2 square kilometers • Created a shape file of the outline of our study area
Methods: LAI AND Tree Extent • LAI from EVI and Dr. Song, Forests from NLCD • Raster Calculator • BL_LAI = (NLCD==41)*LAI • CN_LAI = (NLCD==42)*LAI • MX_LAI = (NLCD==43)*LAI • Weighted Average LAI by tree type in Excel • Reclassification to find extent of Trees
Tree Cover Extent by LAI • Average LAI Results: • Conifer: 6.06 • Deciduous: 8.32 • Mixed: 6.64
Results: Tree cover extent by tree type • Conifer= • 6.3 km2, 8.2% • Deciduous= • 11.9 km2, 15.4% • Mixed= • 1.3 km2, 1.7%
Methods: reforestation potential • Masked South Orange Classification with Chapel Hill/Carrboro Boundaries • Created 2m buffer around impervious and found area of grass, barren within buffer • Calculated areas using pixel count (1m resolution) • Calculated impervious that would be covered by canopy: • Assumed stems would be planted 1m from edge of impervious • Used average crown areas of broadleaf and loblolly to calculate area of impervious covered • Total area to reforest = area of grass, barren + area of impervious covered by canopy
Results: Potential Reforestation sites • Suitable Sites? • Grass/barren land • Parking lots • Alongside streams: Buffers • Alongside impervious: sidewalks and roads
Results: Potential for Reforestation alongside Impervious Surfaces • Area converted from impervious surface to canopy cover : • Broadleaf species: 3,858,701 m2 • Loblolly pine: 2,875,216 m2 • Total reforestation area across Chapel Hill and Carrboro,assuming 100% successful reforestation: • Broadleaf: 6.008 km2 • Loblolly: 5.020 km2 for loblolly pines, assuming 100% successful reforestation
Methods: water balance change • Calculated perimeter [L] of impervious area where buffer was grass or barren • Divided area of grass, barren [L2] by 2 (since each pixel is 1 m2) • Found average evapotranspiration rates for loblolly and broadleaf • Loblolly = 0.7360 meters per year, broadleaf = 0.6045 meters per year • Calculated water balance change [L3T-1] through evapotranspiration • Multiplied area of reforestation [L2] by ET rate [LT-1] • Calculated for both loblolly and broadleaf and both 50% and 100% reforestation • Calculated percent increase of ET from current ET rates • Solved system of equations using average LAI to determine makeup (in terms of % conifer and % deciduous) and ET rate of mixed forests • Mixed forest ET rate = 0.7023 meters per year
Results: the effect of reforestation on water balance Table 1. Current evapotranspiration rates and areas for conifer, broadleaf, and mixed forests. Table 2. Water balance changes for half and complete reforestation in potential areas.
Results:Broadleaf vs. loblolly Evapotranspiration Table 3. Percent ET increase over current ET for each reforestation scenario.
Limitation: Ikonos vs. landsat 7 • Trade-off: • Spatial resolution or • Spectral resolution • LAI calculated using Landsat image
Conifer vs. Broadleaf Higher LAI values Offer greater interception, less runoff Spring and summer months Reforest in areas where LAI is low
Conifer vs. Broadleaf Higher LAI values Offer greater interception, less runoff Spring and summer months Reforest in areas where LAI is low
Future directions • Incorporate successful aspects of: • NYC Million tree project • Greening of Detroit
References: literature • Arnold, C. L., and C. J. Gibbons. 1996. Impervious Surface Coverage: The Emergence of a Key Environmental Indicator. Jounral of the American Planning Association 62(2):243-5. • Buttle, J. M. 1994. Hydrological Response to Reforestation in the Ganaraska River Basin, Southern Ontario. The Canadian Geographer 38(3):240-53. • Harms, W. R., D. S. DeBell, and C. D. Whitesell. 1994. Stand and tree characteristics in Pinustaedaplantations in Hawaii and South Carolina. Canadian Journal of Forest Research 24:511-521. • Kim, S. 2007. Individual tree species identification using LIDAR-derived crown structures and intensity data. Ph.D. dissertation, University of Washington, College of Forest Resources, 137 pages. • McNulty, S. G., J. M. Vose, and W. T. Swank. 1996. Loblolly pine hydrology and productivity across the southern United States. Forest Ecology and Management, 86:241-251. • Million Trees NYC. [Internet]. 2012. New York City: Million Trees NYC. [cited 2012 04. 29] Available from: http://www.milliontreesnyc.org/ • Oishi, A. C., R. Oren, and P. C. Stoy. 2008. Estimating components of forest evapotranspiration: A footprint approach for scaling sap flux measurements. Agricultural and Forest Meteorology, 148 (11):1719-1732. • Ray, D. K., J. M. Duckles, and B. C. Pijanowski. 2010. The Impact of Future Land Use Scenarios on Runoff Volumes in the Muskegon River Watershed. Environmental Management 46:351-66. • The Greening of Detroit. [Internet]. 2012. Detroit, MI: The Greening of Detroit. [cited 2012 Apr 29] Available from: http://greeningofdetroit.com/contact-us/ • US Geological Survey. 2011 Oct 27. Earth Resources Observation and Science (EROS) Center, Dept. of the Interior. Retrieved from: http://www.mrlc.gov/nlcd06_leg.php • Woodland Owner Notes: Thinning Pine Stands. [Internet]. 2012. North Carolina: NC State University and NC A&T State University: North Carolina Cooperative Extension. [cited 2012 04. 29] Available from: http://www.ces.ncsu.edu/forestry/pdf/WON/won13.pdf. • Peduzzi, A., R.Wynne, T. Fox, R. Nelson, and V. Thomas. 2012. Estimating Leaf Area Index in Intensively Managed Pine Plantations Using Airborne Laser Scanner Data. Forest Ecology and Management 270:54-65.
References: images • http://www.chapel-hill-north-carolina.com/demographics/ • http://www.unc.edu/community/fire_station.html • http://www.regent.qc.ca/products/scanopy/winscanopymorefeatures.html • http://26.media.tumblr.com/tumblr_l7lcjyuJiX1qdstgoo1_500.jpg: Algal blooms • http://media.treehugger.com/assets/images/2011/10/peru-national-reforestation-campaign.jpg: planting woman