Download
1 / 55
560 likes | 781 Vues
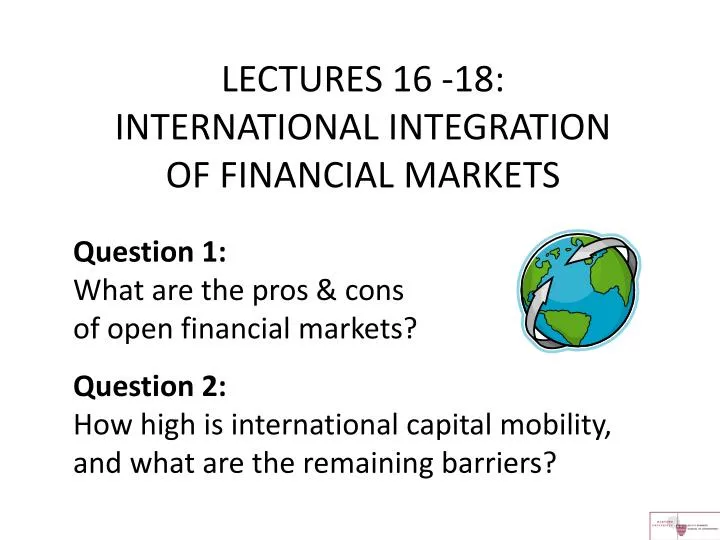
LECTURES 16 - 18: INTERNATIONAL INTEGRATION OF FINANCIAL MARKETS. Question 1: What are the pros & cons of open financial markets? Question 2: How high is international capital mobility, and what are the remaining barriers?. Advantages of financial opening.

E N D
LECTURES 16 -18:INTERNATIONAL INTEGRATION OF FINANCIAL MARKETS • Question 1:What are the pros & consof open financial markets? • Question 2:How high is international capital mobility, and what are the remaining barriers?
Advantages of financial opening For a successfully-developing country, with high return to domestic capital, investment can be financed more cheaply by borrowing abroad than out of domestic saving alone. Investors in richer countries can earn a higher average return on their saving by investing in emerging markets than they could domestically. Everyone benefits from the opportunity to smooth disturbances and to diversify away risks.
Further advantages of financial openingin emerging market economies Letting in foreign financial institutions improves the efficiency of domestic financial markets. It subjects over-regulated and inefficient banks to the harsh discipline of competitionand to the demonstration effect of examples to emulate. Governments face the discipline of the international capital markets if they make policy mistakes.
Classic gains from trade textiles future …Portuguese consumption in textiles rises too, which it imports, thereby reaching a higher indifference curve. • Textiles are cheaper on world markets. In autarky, Portugal can only consume what it produces. (Price mechanism puts it on full-employment PPF & at the point maximizing consumers’ utility.) • Under freetrade, Portugal responds to new relative prices by shifting into wine, where it has a comparative advantage…. • today wine Next, we do the gains from trade again, substituting period 0 & period 1, in place of wine & textiles. Maximize u(C0) + β u(C1) subject to constraint.u’(C)>0; u’’(C)<0; β<1.
Intertemporal trade: • Welfare gains from open capital markets. • Even without intertemporal reallocation of output, consumers are better off at B than A(borrowing from abroad to smooth consumption). • In addition, firms can borrow abroad to finance investment, then consuming at C . future • • today future • today
Does this theory ever work in practice? • Norway discovered NorthSea oil in 1970s. • It temporarily ran a large CA deficit, • to finance investment (while the oil fields were being developed) • & to finance consumption (as was rational, since Norwegians knew they would be richer • in the future). } } Subsequently, Norway ran big CA surpluses. ITF220 Prof.J.Frankel
Effect when countries open their stock markets to foreign investors, on cost of capital. CAPITAL ACCOUNT LIBERALIZATION: THEORY, EVIDENCE, AND SPECULATION Peter Blair HenryNBER Working Paper 12698 Liberalization occurs in “Year 0.” Cost of capital falls,on average.
Effect when countries open their stock markets to foreign investors, on investment. CAPITAL ACCOUNT LIBERALIZATION: THEORY, EVIDENCE, AND SPECULATION Peter Blair HenryNBER Working Paper 12698 Liberalization occurs in “Year 0.” Investment rises,on average.
Indications that financial marketsdo not always work as advertised Crises => Financial markets work imperfectly The 1982 international debt crisis; 1992-93 crisis in the European Exchange Rate Mechanism; EM currency crashes of the late 1990s: 1994-95 Mexico;1997 E.Asia, esp. Thailand, Korea & Indonesia;1998 Russia, 2000 Turkey, 2001 Argentina. 2008-2010 GFC (U.S. & U.K.: “North Atlantic Financial Crisis” !) Iceland, Hungary, Latvia, Ukraine, Pakistan…; The 2010 euro crisis (Greece, Ireland, Portugal, Spain…).
Indications that financial markets do not always work as advertised, cont. Do investors punish countries when and only when governments follow bad policies? Large inflows often give way suddenly to large outflows, with little news appearing in between to explain the change in sentiment. Contagion sometimes spreads to countries that are unrelated, or where fundamentals appear stronger. Recessions have been so big, it is hard to argue that the system works well.
Economic crashes can be severe, such as East Asia 1997-98 Source: Guillermo Calvo, 2006.
Other indications that financial marketsdo not always work as advertised More generally, capital flows have: (i) not on average gone from rich countries (high K/L) to poor (low K/L) – The “Lucas paradox.” (ii) often been pro-cyclical, not counter-cyclical. • Possible explanations:In developing countries, • (i) investors cannot reap the potential returns to capital due to inferior institutions, esp. inadequate protection of property rights… (Alfaro, Kalemli-Ozcan & Volosovych, 2008). • (ii) fluctuations that appear cyclical, in truth may signal changes in long-run growth prospects. (Aguiar & Gopinath, 2007) .
Empirical studies of financial opennessand economic performance,reviewed by Kose, Prasad, Rogoff & Wei (2009), often find little systematic relationship, in either direction.
income -- Biscarri, Edwards, & Perez de Grarcia(2003); Klein & Olivei(1999); Edwards (2001); Martin & Rey (2002); Ranciere, Tornell & Westermann(2008); financial depth, institutional quality&other reforms -- Kaminsky & Schmukler (2003); Chinn & Ito (2002); Klein (2003); Obstfeld (2009); Kose, Prasad & Taylor (2009); Wei & Wu (2002); Prasad, Rajan & Subramanian (2007). Or macroeconomic discipline.-- Arteta, Eichengreen & Wyplosz(2001). Some studies find that financial openness is helpful only if countries have already attained an adequate level of: => Conventional wisdom regarding sequencing: it is better to liberalize financial markets only afterother reforms have been put in place. -- McKinnon (1993), Edwards (1984, 2008), and Kaminsky&Schmukler(2003).
Measuring International Financial Integration Source: Kose, Prasad, Rogoff & Wei (2009) • Direct measures of barriers, e.g., IMF’s count of freedom from KA restrictions. • II. “Price tests” • III. “Quantity tests”
I. Direct Measure of Financial Liberalization Openness: Chinn & Ito Menzie Chinn & Hiro Ito, "A New Measure of Financial Openness," (Journal of Comparative Policy Analysis, 2008), updated 2013 http://web.pdx.edu/~ito/Chinn-Ito_website.htm.
Chinn-Ito Measure of Financial Openness The calculations are based on 4 categories in the IMF’s Annual Report on Exchange Arrangements & Exchange Restrictions: multiple exchange rates, current account restrictions, capital account restrictions, and required surrender of export proceeds.
Macro-prudential regulations such as reserve requirements, are an increasingly important alternative to capital controls Housing market regulations: LTV≡ maximum Loan-to-Value ratio. DSTI ≡ maximum Debt Service to Income ratio. Source: PIMCO, April 2011 Global Central Bank Focus http://www.pimco.com/en/insights/pages/the-end-of-qeii-it%E2%80%99s-time-to-make-the-donuts.aspx Kenneth Kuttner&Ilhyock Shim, BIS WPs, 2013, “Taming the Real Estate Beast: The Effects of Monetary and Macroprudential Policies on Housing Prices and Credit” tightened in response to housing bubble concerns.
Measuring International Financial Integration, cont. II. “Price” tests 1.Uniform price of an asset across markets, e.g., i) Arbitrage between China’s A shares and off-shore; ii)Arbitrage between a CountryFund&itsconstituent assets 2. Interest rate parity (IRP) i) Covered interest parity (CIP) ii) Uncovered interest parity (UIP) iii) Real interest parity (RIP)
1. Price of the same asset across borders A shares, which domestic residents held, sold at a premium to B shares, which Chinese firms could issue to foreign investors. (i) Chinese firms’ stock prices, onshore relative to offshore: } Higher prices on-shore Source: Vicki Wei Tang (2011) In the 1990s, foreign residents held B shares, listed in Shenzhen or Shanghai. In 2001, Chinese citizens were allowed to buy B shares.
Chinese firms’ stock prices, onshore reltiveto offshore, continued Now “H shares” (held in Hong Kong)are more important. Premium of “A shares” (held domestically), over “H shares” . } Higher prices onshore Higher prices on-shore “Investing in Chinese shares,” Economist, Sept. 27, 2014 Robert McCauley, CFR conference on Internationalization of the RMB, Beijing, Nov.2011, Graph 5. Data Source: Bloomberg, BIS Note: company composition of the two indices differs.
(ii) Country funds Differential Source: Frankel & Schmukler (1996) The NYC price of a Mexican basket of stocks≠theNet Asset Valueof the components traded in Mexico City => imperfect arbitrage. Notice: In the 1994 peso crisis, the local NAV fell (i) more than the fund price in NYC, and (ii) before the devaluation hit => suggesting that locals might have had better information.
2. Interest Rate Parity:WHY DOES i NOT EQUAL i* ? Currency factors Expected currency depreciation Exchange risk premium The currency premium can be measured as the forward discount, or swap rate, or differential between domestic & local $-linked bonds. II.Country factors …
} Decomposition of the Nominal Interest Differential i – i* ≡ country premium + currency premium e.g., ≡ (i – i* - fd) + fd fd ≡ (fd - Δse) + (Δse) exchange + expected risk nominal premium depreciation The country premium could be measured by the covered interest differential (i-i*-fd), sovereign spread, or Credit Default Swap. The currency premium could be measured by the forward discount (fd), currency swap rate, or local spread of $-linked vs. domestic-currency bonds.
WHY DOES i NOT EQUAL i* ? II.Country factors, continued Default risk – reflected in sovereign spreads or Credit Default Swaps Capital controls – reflected in covered interest differentials Taxes on cross-border investments Transaction costs Imperfect information Risk of future capital controls
Sovereign spreads Brazilian interest rate decomposed country premium + currency premium + LIBOR } } Total spread (Brazil rate minus LIBOR) = Currency premium (forward premium) + Country premium (spread) 1995-98
Sovereign spreads Mexican spread decomposed: currency premium + country premium 2004-13 Total spread for Mexican sovereign bonds over US Treasury bill interest rate Currency premium ≡ pesos/$ swap rate Country premium ≡ total spread adjusted for currency premium Total spread over US T bill rate Country premium Currency swap rate Wenxin Du & Jesse Schreger, “Sovereign Risk, Currency Risk & Corporate Balance Sheets,” Oct. 14, 2014
Downtrend in SA country risk premium,to below 100 basis points by 2006, in tandem with upgrades by rating agenciesSource: SA Treasury Sovereign spreads Sovereign spreads on South African Dollar Debt 1996-2006
as among other emerging markets Sovereign spreads, 2003-06 Spreads were low for Emerging Market bonds in 2006, and even lower for South Africa, Global investors were under-pricing risk -- as also reflected in US corporate spreads, options prices, etc. All of them shot back up in 2008.
Sovereign spreads for 5 euro countries shot up in the 1st half of 2010
┌┐ ┌┐ ┌┐ ┌┐ The forward market The forward market Source:Financial Times 11//2/2007 Selling at a forward discount against the $: Turkish lire Argentine peso Brazilian real Spread is wider for Sol than є Selling at a forward premium against the $: Yen New Taiwan $ UAE dirham
During Global Financial Crisis Financial TimesJan. 30, 2009 Selling at a forward discount against the $: Hungarian forint Russian ruble Turkish lire Argentine peso Indonesian rupiah S.African rand Selling at a forward premium against the $: S.Korean won
COVERED INTEREST PARITY ( 1+ iTurkey)= Forward discount fd (F-S)/S => 1 + fd F/S => (1 + iTurkey) = (1 + fd) (1 + iUS). = (1 + fd + iUS + fd iUS). Because (fd iUS) is small, iTurkey ≈ fd + iUS . => If the Turkish nominal interest rate exceeds the U.S. rate, then the lira sells at a discount in the forward exchange market. (1/S) ( 1+ iUS) F where S is the spot rate in TL/$ and F is the forward rate.
THREE INTEREST RATE PARITY CONDITIONS CIP UIP RIP
Liberalization in a country that had controls on capital inflows. Domestic & offshore interest rates,Germany, 1973-74 } From: Marston (1989)
Liberalization in a country that had controls on capital outflows Domestic & offshore interest rates,France, June 1973- June 1993 { From: M. Mussa and M. Goldstein, “The Integration of World Capital Markets,” FRBKC, 1993. France kept its controls on capital outflows until the late 1980s. Again, they produced an offshore-onshore differential, which shot up whenever there was speculation of a franc devaluation. Again, the differential disappeared after controls were removed.
Summary of Interest Rate Parity conditionsto be used in L19: Exchange Rate Models } • Covered interest parity • + • No risk premium • => • Uncovered interest parity , • + • Ex ante Relative Purchasing Power Parity } => Real interest parity .
Quantity tests point to surprisingly low international integration • Home bias in portfolios: Do citizens of each country hold a basket of assets that is optimally diversified internationally? • Consumption risk-sharing: Are countries’ consumption levels correlated with each other more than country incomes? • Feldstein-Horioka test: Do countries’ Investment rates vary independently of their National Saving rates? No No No
Appendices: Country risk • Appendix 1: EM Sovereign Spreads • More examples • “Risk on – risk off” • Appendix 2: Inter-shuffling of credit-worthiness between advanced & developing countries • Recent credit rating rankings • The end of “original sin”?
Appendix 1: EM sovereign spreads Spreads shot up in 1990s crises 1994-2001
EM sovereign spreads Spreads fell to low levels by 2007. WesternAsset.com
EM sovereign spreads Spreads rose againin Sept. 2008, • especially on $-denominated debt Bpblogspot.com • & in Eastern Europe. World Bank
What determines spreads? EMBI is correlated with risk perceptions risk off “risk on” Laura Jaramillo & Catalina Michelle Tejada, IMF Working Paper, March 2011
1) Since the crisis of the euro periphery began in Greece in 2010, we have become aware that “advanced” countries also have sovereign default risk. 2) Since 2000, Emerging Market Countries have increasingly been able to borrow in their own currencies, so their debt carries currency risk (not just default risk). Appendix 2: The blurring of lines between debt of advanced countries and developing countries
1) Country creditworthiness wasinter-shuffled S&P ratings, Feb.2012updated 8/2012 “Advanced” countries (Formerly) “Developing” countries AAA Germany, UK Singapore, Hong Kong AA+ US, France AA Belgium Chile AA- Japan China A+ Korea A Malaysia, South Africa A- Brazil, Thailand, Botswana BBB+ Ireland, Italy, Spain BBB- Iceland Colombia, India BB+ Indonesia, Philippines BB Portugal Costa Rica, Jordan B Burkina Faso SD Greece
Sovereign debt credit ratings over 2006-2010for some advanced countries fell, while ratings for some emerging markets rose. Ratings for “Advanced Economies” Ratings for “Emerging Economies”
Spreads for Italy, Greece, & other Mediterranean membersof € were near zero, from 2001 until 2008and then shot up in 2010 Market Nighshift Nov. 16, 2011
2) The end of Original Sin:After 2000, Emerging Markets successfully issued more debtin their own local currencies (LC), instead of $-denominated (FC). Fig. 2 from Jesse Schreger & Wenxin Du “Local Currency Sovereign Risk,” HU, March 2013
Turkey is able to borrow in local currency (lira),but has to pay a high currency premium to do so. { Total premium on Turkey’s lira debt over US treasuries Pure default risk premium on lira debt { Fig. 5 from Schreger & Du,“Local Currency Sovereign Risk,” HU, March 2013