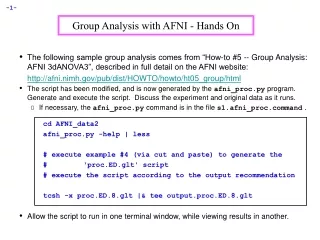
Download
1 / 30
310 likes | 352 Vues
Functional MRI Analysis with AFNI accents. R obert W C ox robertcox@mail.nih.gov. July 2017. To Dream the Impossible Dream. i.e. , To explain FMRI Analysis in 60 min Basis for FMRI time series analysis : 10-20 inter-twined concepts

E N D
Functional MRI Analysiswith AFNI accents Robert WCox robertcox@mail.nih.gov July 2017
To Dream the Impossible Dream • i.e., To explain FMRI Analysis in 60 min • Basis for FMRI time series analysis: • 10-20 inter-twined concepts • pre-processing ; individual subject analysis ; group analysis ; connectivity ;… • Many seem simple, but each one has subtleties and points of contention • Can only cover the most central ideas now • Absolute Beginners: Confusion Ahead!
Some Goals of FMRI Analyses • Task-based experiments • Per subject: estimate amplitude of BOLD response to each different type of stimulus • Model+Estimate inter-regional correlations between fluctuations in BOLD responses • Resting-state experiments • Measure spatial patterns in coherent fluctuations in spontaneous BOLD effects • Group level • Combine and contrast per subject results
pre-processing Conceptual Basis - 1 • Time shifting= pretend get 3D snapshot • Despiking= remove large blips • Image Registration(AKA alignment) • intra-EPI time series, and EPI-Structural • Blurring in space= lower resolution :-( & less noise :-)& more group overlap :-) • Masking= ignore non-brain voxels • Scaling=normalizing data amplitude • Makes inter-subject comparisons more valid
Conceptual Basis - 2 • Time series regression • model of the BOLD response in the data =Hemodynamic Response Function convolved with stimulus timing • plus baseline (null hypothesis) model • plus physiological noise • plus allow for serial correlation • plus allow for random response strength (!!) • Talairach-ing= Spatial Normalization • Talairach, MNI-152, … • affine and nonlinear spatial transformations
Conceptual Basis - 3 • Group Analyses= Putting it all together • ANOVA, LME, MVM, Meta-Analyses, … • Blobs= Spatial models of activation • Assigning statistical significance to blobs • Connectivity= Inter-regional analyses • SEM, PPI, SVAR, DCM, … • Resting state FMRI (Connectome!) • Dimensional factorization • Components, such as PCA, ICA, …
Conceptual Basis - 4 • Data Formats= NIfTI-1.x is your friend • Software for FMRI analyses: • AFNI*, BrainVoyager, FSL*, SPM*, … • Whichever you use, don't blindly assume the software works perfectly all the time • Most important thing I will say today Understand and check the steps applied to your data! • 2nd most important: Is no "best" way to analyze data, just "reasonable"ways *open-source
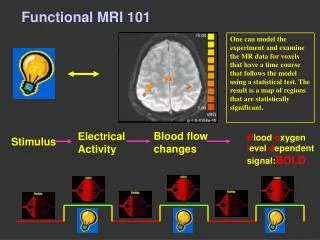
Time Series Regression • After pre-processing the images: • Each voxel time series is (separately) fit to an idealized model of the BOLD effect • Plus other (nuisance) components • Baseline drift, physiological artifacts, … • Estimated parameters of the BOLD model are the "activation map" • Amplitude of response = most common • Shape of response can also be modeled • Statistics on parameters allow thresholding
Basic BOLD Model • Assumptions: • BOLD response starts ≈ 2s after "activity" • Rises to peak about ≈ 4s later • Drops to baseline about ≈ 5s post-activity • Overlapping (in time) BOLD responses from separate events add up =linearity
Further Model Pieces-Parts • FMRI data = pretty noisy • Need multiple copies of each stimulus type • Assume BOLD responses same within type • Slow drifting terms in baseline • Residual effects of subject movements • Use motion parameters as extra regressors • Include physiological regressors (RetroICOR) • From monitoring heartbeat & respiration • Serial correlation in noise use GLSQ highpass filter
Sample Linear Regression Model Motion Params BOLD + Stimuli Models Slow Drift Model
One Voxel's Time Series • This is good data at a high signal voxel • 2 stimulus classes; 1 block every 30s; TR=2s Black = 150 data points Red = fitted model (BOLD++) Data: Mike Beauchamp/UTexas
Results from One Subject ShowThru rendering of difference between visual and auditory BOLD amplitudes
Talairach-ing(AKA Normalizing) • For combining and contrasting results across groups of subjects • Align 3D brain images (usually structural volumes) to a common template • Assumption: function follows structure • Then merge results on a voxel-wise basis on this new grid • Accuracy of alignment = 5-10 mm • Spatial blurring = more inter-subject overlap
FCON-1000 (affine) Templates • Ye Good Olde Days =Talairach-Tournoux atlas • Decadent modern times =MNI-152 template = average of 152 brain images 1.5T 3.0T 3.0T MNI-152 (affine) FCON-1000 (poly9)
Custom Templates • Can register all subjects in study together iteratively • Then average to get a study-specific template • Can use high order nonlinear spatial warps for better structural feature alignment 3.0T 101 subjects AFNI3dQwarp Data: MindBoggle • Alternatives: • ROI or Atlas-based analyses • Cortical surface-based analyses [cf. SUMA]
Group Analysis • Group analysis is done in 2 stages: • Individual subject analyses reduce EPI time series to BOLD response parameters • Inter-subject analysis is done on these parameters (e.g., measures of amplitude) • Usually have some estimate of reliability of these parameters (e.g., standard deviation) • Normalization of data magnitude and spatial normalization are important steps
Flavors of Group Analysis - 1 • t-tests for simple 2-way contrasts • ANOVA of various complexities for more intricate collective effects • Usually end up wanting to do t-tests on these "main" effects to see What's Up (Doc) • Plain ANOVA relies on many assumptions about distribution of randomness • Independent noise (or all samples are correlated the same way; "sphericity") ; Gaussianity ;Homoscedasticity (all samples have same variance) ; Balanced designs
Flavors of Group Analysis - 2 • Linear Mixed Effects (LME) and Multi-Variate Models (MVM) generalize ANOVA to avoid such assumptions • Meta-Analysis: Statistics run on statistics • Which is exactly what we are doing in FMRI • Many developments in the 1990s • Can be applied to FMRI data, using not just the individual subject amplitudes, but also their reliability estimates;cf. AFNI and FSL • Can also model non-Gaussianity (outliers)
Meta-Analysis Results Meta-Analysis Task A: 20 sub Task B: 12 sub Task C: 11 sub ANOVA Yellow = Stronger Data: James Bjork/NIH
Blobs! [AKA Clusters] • For most purposes, if we saw that all the statistically significant activation was just in tiny and scattered clusters, we would be suspicious and upset • We not only threshold on voxel-wise t- or F-statistics, but we also threshold on size of contiguous supra-threshold clusters • Allows us to lower the per-voxel threshold by raising the cluster-size threshold to maintain error rate control
Blob Significance (!!) • Probability that a smooth noise-only image would produce a blob, with each voxel above a given threshold and the size of the blob above a given cutoff • Cannot be calculated in closed form :-( • Two approaches available: • Asymptotic formula for high per-voxel thresholds and high degrees of smoothness • Direct Monte-Carlo simulation (brute force) • Which to use? Depends on your software! K Worsley AFNI
Connectivity • FMRI basis: Fluctuations in neural activity fluctuations in BOLD signal • Task performance changes between repetitions can give coherent signal changes in remote brain regions • Can look for causal changes also: • e.g., Predictability of one region's data from another's data at a previoustime step • Limited TR of FMRI data makes this iffy • Probably need TR < 1s to do this well
Task-Based Connectivity • Fluctuations from model fit can be bigger than noise; recall this graph from 1 voxel • So can subtract the fit and then look for inter-voxel correlations (if have enough data)
Flavors of Connectivity - 1 • Simple correlation from a seed region (or voxel) with all other voxels in brain • Ambitiously: Correlate All-with-All :-) • Then group analysis for statistical power • Used in resting-state FMRI analyses +0.4 -0.4 RS-FMRI: 15 subjects Data: Alex Martin/NIH
Flavors of Connectivity - 2 • PPI =Psycho-Physiological Interaction • We call it "Context Dependent Correlation" • Augment the regression model with data time series averaged from a seed region • And multiplied by +1 in context A, -1 in context B, and 0 in other cases (e.g., baseline) • Fit parameter for new regressor measures fluctuations in EPI signal whose correlation with seed region changes between contexts (A&B) • Context = "Psycho" ; EPI/BOLD = "Physio"
Flavors of Connectivity - 3 • Network models use multiple regions, try to fit multiple dependencies amongst them • FMRI noise means must average over pre-chosen regions before network hunting+fitting • Anatomical ROIs or Functional ROIs? • Instantaneous directional effects: • Structural Equation Modeling (SEM) • Delayed (causal) effects: • Dynamic Causal Modeling (DCM) • Structural Vector AutoRegression (SVAR)
Connectivity Conclusions • Often: make statement about changes in connectivity between two situations • Absolute connectivity statements are somewhat less common (though not rare) • When contrasting subject groups, must be careful that physiological differences (e.g., respiration) are accounted for • Especially in resting-state studies, which don't have any task-timing to which we can tie down the analysis
Final Gratuitous Remarks • Multi-stimulus linear regression models for task-based FMRI appear in mid-1990s • Since then, most task-based FMRI time series analysis improvements have been incremental and/or controversial and/or of limited scope —IMHO • Are we near the limit of what kind of information can be gleaned from current-technology FMRI datasets? • Or do we just need to be cleverer?
Th'Th'That's All Folks! • Thanks must go to • Ziad Saad, Gang Chen, Rick Reynolds, Daniel Glen, Paul Taylor • James Hyde, Peter Bandettini, Andrzej Jesmanowicz • Elliot Stein, Jeff Binder, Steve Rao, Alex Martin, Leslie Ungerleider, Ted Deyoe, …and too many more brain-ologists to name herein Data: Warner Bros.