Download
1 / 35
350 likes | 512 Vues
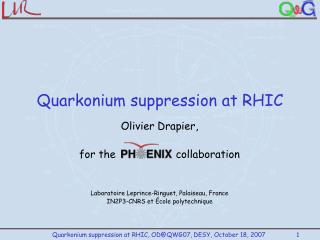
Quarkonium suppression at the SPS. or. Are the SPS J/ and ’ suppression patterns “smoothy” or “steppy” ?. International Workshop on Heavy Quarkonium, DESY, Oct. 2007. Carlos Louren ç o. The QCD phase transition.

E N D
Quarkonium suppression at the SPS or Are the SPS J/ and ’ suppression patterns“smoothy” or “steppy” ? International Workshop on Heavy Quarkonium, DESY, Oct. 2007 Carlos Lourenço
The QCD phase transition QCD calculations indicate that, at a critical temperature around 170 MeV, strongly interacting matter undergoes a phase transition to a new state where thequarks and gluons are no longer confinedin hadrons hadrons quarks and gluons
The phase diagram of QCD Early universe quark-gluon plasma Tc hadron gas Temperature nuclei nucleon gas 0 net baryon density
Free the quarks! The first QCD Phase Diagram N. Cabibbo and G. Parisi, Phys. Lett. B59 (1975) 67
The really first QCD Phase Diagram So Dark the Confinementof Man For details, see: “The Da Vinci colour Code” Not easy to see...unless you know what you are looking for
Pb208 Pb208 p+ p p- How do we study bulk QCD matter? We heat and compress a large number of hadrons, in the lab, by colliding heavy nuclei at very high energies
One Pb-Pb collision seen by NA49 at the CERN SPS
“Seeing” the QCD matter formed in heavy-ion collisions We study the QCD matter produced in HI collisions by seeing how it affectswell understood probes as a function of the temperature of the system (centrality of the collisions) Matter under study QGP ? Probe Calibrated “probe source” Calibrated “probe meter” Calibrated heat source
Challenge: find the good probes of QCD matter vacuum The good QCD matter probes should be: Well understood in “pp collisions” Only slightly affected by the hadronic matter, in a very well understood way, which can be “accounted for” Strongly affected by the deconfined QCD medium... hadronicmatter QGP Heavyquarkonia (J/, ’, c, , ’, etc) are good QCD matter probes !
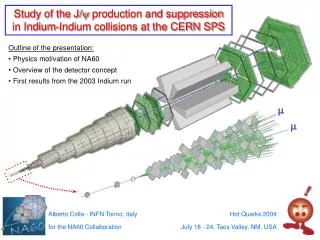
Challenge: creating and calibrating the probes The “probes” must be produced together with the system they probe (!)and very early, to be there before the matter to be probed: quarkonia We need “trivial” (reference) probes,not affected by the dense QCD matter:photons, Drell-Yan dimuons We need “trivial” collision systems,to understand how the probes are affectedin the absence of “new physics”:pp, p-nucleus, light ions
“Tomography” of the produced QCD matter Tomography in medical imaging: Uses a calibrated probe and a well understood interaction to derive the 3-D density profile of the medium from the absorption profile of the probe. “Tomography” in heavy-ion collisions: - Jet suppression gives the density profile of the matter - Quarkonia suppression gives the confinement state (hadronic or partonic) of the matter
In the beginning was the Verb, and the Verb was… The suppression of the J/ production yield in nuclear collisions should be a clear signal of the QCD phase transition from confined hadronic matterto a deconfined plasma of quarks and gluons “... colour screening prevents c-cbar binding ...”
Lattice QQbar free energy T The “melting” of the heavy-quarkonia states In the deconfined phase the QCD potential is screened and the heavy quarkonia states are “dissolved” into open charm or beauty mesons. Different heavy quarkonium states have different binding energies and, hence, are dissolved at successive thresholds in energy density or temperature of the medium; their suppression pattern woks as a “thermometer” of the produced QCD matter.
1.10 0.74 0.15 A “smoking gun” signature of QGP formation: steps The feed-down from higher states leads to a “step-wise” J/suppression pattern ’ “Well known” J/ cocktail: 60% direct J/ 30% from c decays 10% from ’ decays HERA-B J/ cocktail: 72% direct J/ 21% from c decays 7% from ’ decays c
reference process J/ normal nuclear absorption curve Drell-Yan dimuons are not affected by the dense medium they cross J/ suppression: from theory predictions to SPS data p-Be p-Pb centralPb-Pb reference data The yield of J/ mesons (per DY dimuon) is “slightly smaller” in p-Pb collisions than inp-Be collisions; and is strongly suppressedin central Pb-Pb collisions Interpretation:strongly bound c-cbar pairs (our probe) are “anomalously dissolved” by the deconfined medium created in central Pb-Pb collisions at SPS energies
J/ ’ 2/ndf = 0.7 2/ndf = 1.4 The J/ and ’ “normal nuclear absorption” in p-A collisions NA50 NA50 p-A 400 GeV The Glauber model describes the J/ and ’ “normal nuclear absorption”, in p-A collisions, in terms of the average path length, L, which they traverse in the target nucleus, from the production point to the nuclear “surface”
NA60: a third generation J/ experiment at the SPS NA60 collected less J/ events in In-In than NA50 in Pb-Pb but they are directly compared to the normal nuclear absorption curve, calculated with “Glauber”, without using the “statistically challenged” Drell-Yan yield normal nuclear absorption ~ 29 000 J/ dimuons The calculation of Npart for each EZDC bin uses the Glauber model,which reproduces distributions collected with minimum bias triggers (no dimuons)
J/ suppression at the SPS: In-In vs. Pb-Pb patterns There is a good agreement between the Pb-Pb and In-In suppression patterns when plotted as a function of the Npart variable, determined from the (same) ZDC detector. The statistical accuracy of the In-In points is, however, much better... The pink box represents the ±6% global systematic uncertainty in the relative normalization between the In-In and the Pb-Pb data points.
Question: Is there a “step” in the SPS J/ suppression pattern measured at the SPS ? Answer: Now there is Now there isn’t...
Digal, Fortunato and Satz EPJ C32 (2004) 547 Grandchamp and Rapp NP A715 (2003) 545PRL 92 (2004) 212301 Capella and Ferreiro hep-ph/0505032 J/ suppression at the SPS: model tuning on the Pb data CF: suppression by “comovers” DFS: percolation phase transition GR:dissociation and regeneration in QGP and hadron gas, inc. in-medium properties of open charm and charmonium states Pb-Pb @ 158 GeV
Solutions: Capella & Ferreiro = 49 Digal et al. = 21 Rapp (fixed t0) = 14 Rapp (variable t0) = 9 Data vs. theoretical predictions: the results S. Digal et al. EPJ C32 (2004) 547 R. Rapp EPJ C43 (2005) 91 centrality dependent t0 None of these predictions describes the measured suppression pattern... Homework exercise: calculate the 2/ndf for eachof these curves (ndf = 8) In-In 158 A GeV R. Rapp EPJ C43 (2005) 91 fixed termalization time t0 A. Capella, E. Ferreiro EPJ C42 (2005) 419 Note: the In-In data set was taken at the same energy as the Pb-Pb data...to minimise the “freedom” of the theoretical calculations Note: by moving up or down all the data points, within the 6% uncertainty on their global normalisation, we can get better (and worse) agreements...but even in the best cases, the 2/ndf remains very high...
This figure Data vs. theoretical post-dictions... Nuclear plus hadron gas absorption L. Maiani et al., NP A748 (2005) 209 F. Becattini et al., PL B632 (2006) 233 Nuclear absorption only... plus largest possible absorption in a hadron gas(T = 180 MeV)
In-In 158 A GeV Charmonium dynamics in heavy ion collisions O. Linnyk et al., SQM 2007, June 28, 2007 and Nucl. Phys. A 786 (2007) 183. HSD 2/ndf = 7.4 2/ndf = 16 ndf = 8 The probability that the measurements should really be on any of these two curves and “statistically fluctuated” to where they were in fact observed is... zero
In-In data vs. a step function in Npart 1 Measured / Expected A1 A2 Npart Step position Step at Npart = 86 ± 8 A1 = 0.98 ± 0.02 A2 = 0.84 ± 0.01 2/ndf = 0.75 (ndf = 8-3 = 5) Taking into account the EZDC resolution, the measured pattern is perfectly compatible with a step function in Npart
A step function in Npart or in another “physics variable” ? Npart is convenient to compare the measured In-In and Pb-Pb data, since it is derived from the same EZDC variable (measured by the same detector) using the same Glauber formalism (except for different nuclear density functions). Also, the derivation of Npart from EZDC is trivial and essentially model independent. Maybe the “real variable” driving charmonia suppression is not Npart. Then, the measured smearing is the convolution of the detector resolution with the “physics smearing”, due to the conversion from the “real variable” to Npart But the Npart “detector resolution” is 20 and the “total resolution” from fitting the measured pattern is 19 (!) indicating that the “physics smearing” is negligible with respect to the detector resolution... In summary, the In-In pattern indicates that: 1) there is a step and 2) the “physics variable” is Npart
1 Measured / Expected A1 A2 A3 Npart Step positions What about the Pb-Pb pattern? Another step? Steps: Npart = 90 ± 5 and 247 ± 19 A1 = 0.96 ± 0.02 A2 = 0.84 ± 0.01 A3 = 0.63 ± 0.03 2/ndf = 0.72 (ndf = 16-5 = 11) If we try fitting the In-In and Pb-Pb data with one single step we get 2/ndf = 5 !.. In summary, the Pb-Pb pattern 1) rules out the single-step function and 2) indicates the existence of a second step...
’ suppression in heavy-ion collisions at the SPS The ’ suppression pattern also shows a significantly stronger dropthan expected from the “normal extrapolation” of the p-A data ’ ’ abs ~ 20 mb The “change of slope” at L ~ 4 fm is very significant and looks very abrupt... The third step of the day ! Starts to look like a “stairway to heaven”...
Back to the ideal world The predicted patterns, before any data points were available,were quite different from each other We thought it was going to be very easy to discriminate between the two theories... J/ survival probability normal nuclearabsorption suppressionby QGP c Energy density We made measurements, to rule out one of these two scenarios (or both)
Observations made at CERN Can any of the models describe the experimental data points?
“outlier” point;to be rejected Data versus the “no new physics” model normal nuclearabsorption All kept data points agree with the expected normal nuclear absorption pattern!
calibrationerror Data versus the “new physics” model anomaloussuppression All kept data points agree with the expected QGP suppression pattern!
A more detailed theoretical framework direct J/suppression gluonanti-shadowing J/y survival probability J/ survival probability ’, csuppression B decays recombinationof uncorrelated ccbar pairs Energy density New and improved data points are needed
Improved model versus new experimental data Once again, the model prediction agrees with the measurements...
Take-home messages... 1) There is a BIG difference between “the measurements are compatible with the model expectations...” and “the measurements show beyond reasonable doubt that the model is good” 2) “Nature never tells you when you are right, only when you are wrong” You only learn something when the theory fails to describe the data... [Bacon, Popper, Bo Andersson] Be happy if your model is shown to be wrong… 3) Today, none of the “fancy theories” describes the In-In suppression pattern All the “fancy theorists” should be happy 4) The very simple step function gives a perfect description of the In-In pattern; a second step is needed to describe the Pb-Pb pattern We found what we were told to look for, as a “smoking gun QGP signal”the experimentalists should be happy