Download
1 / 20
350 likes | 1.1k Vues
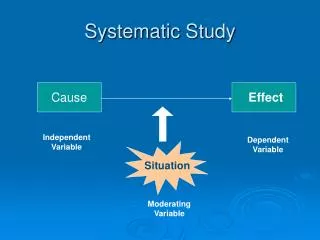
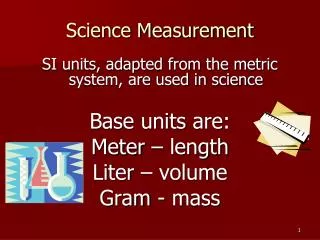
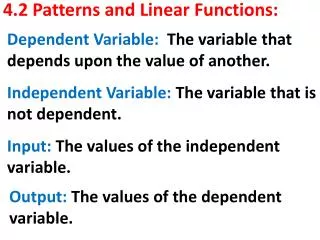
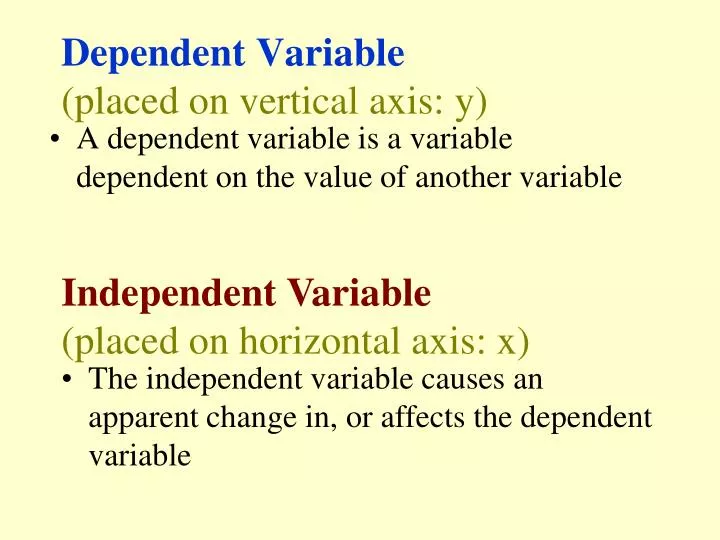
Dependent Variable (placed on vertical axis: y). A dependent variable is a variable dependent on the value of another variable. Independent Variable (placed on horizontal axis: x). The independent variable causes an apparent change in, or affects the dependent variable. Examples:

E N D
Dependent Variable(placed on vertical axis: y) • A dependent variable is a variable dependent on the value of another variable Independent Variable(placed on horizontal axis: x) • The independent variable causes an apparent change in, or affects the dependent variable
Examples: • In a call centre, the number of customers serviced depends on the number of agents • At ski resort, the amount of sales, in $, depends on the amount of snow • The amount of bacteria on your hands depends on how often frequently you use hand sanitizer. dependent variable (y) independent variable (x)
positive negative no
Strong or Weak Correlation? If the points nearly form a line, then the correlation is ___________________. If the points are dispersed more widely, but still form a rough line, then the correlation is _______________________. strong weak
Does age have a strong positive correlation with height? Explain. • Do you think the variables are placed appropriately on the axes? • c) Would weight vs. age show a strong positive correlation? • d) Can you think of a variable that does have a strong positive correlation with age? • e) Can you think of a variable that has a strong negative correlation with age?
Line of Best Fit …affectionately known as LOBF
All about the LOBF… • shows a trend or pattern on a scatterplot • used to make predictions How do I draw it? What is it? • models the trend/pattern • models the trend/pattern • through as many points as possible • equal points above and below the line
Line of Best Fit To be able to make predictions, we need to model the data with a line or a curve of best fit. Guide for drawing a line of best fit: 1. The line must follow the ______________. 2. The line should __________ through as many points as possible. 3. There should be ____________________________ of points above and below the line. 4. The line should pass through points all along the line, not just at the ends. trend pass equal
#2 #1 #4 #3 And what is wrong with the others? Line not in middle of points Which one of these is the best LOBF? Doesn’t model trend Wrong for all kinds of reasons!
Return to front side of hand out and make lines of best fit on each of the given 6 graphs.
You can use LOBF’s to make predictions for values that are not actually recorded or plotted. Extrapolation Interpolation • prediction involving a point outside the set of data • prediction involving a point within the set of data (line needs to be extended)
Extend the line! Is this interpolation or extrapolation? How tall would a person be that had a humerus of 44 cm? 181 cm tall Using our height and humerus data… exptrapolation
Is this interpolation or extrapolation? How long would a person’s humerus be that was 163 cm tall? 28 cm long Using our height and humerus data… interpolation
Makin’ sure you get it! See bottom of handout