Download
1 / 86

E N D
How have you used data or maps in your work? 1957 Wally Freeland
Why Are Maps Useful Visualizations? • Help reveal larger place-based • dynamics that numbers by • themselves cannot • Connect community knowledge and data to location • Support strategythrough communicating patterns to a broad audience, clearly, quickly, and dramatically
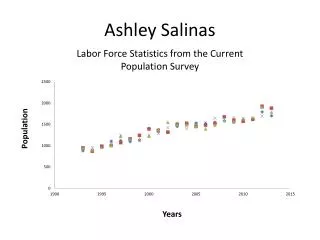
Visualizing Data Over Time: Los Angeles County Firearm Deaths 1990 1991 1992 1993 1994 1995 1996 1997 1998 1999 2000 2001 2002 2003 2004 2005 2006 1989
Healthy City is a project of… • A public policy change organization rooted in the civil rights movement
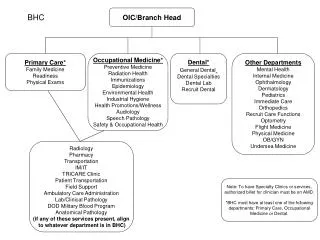
ONLINE MAPPING TECHNOLOGY www.HealthyCity.org DIRECT TECHNICAL SUPPORT : Work ON-THE-GROUND to develop targeted research/policy strategies and web tools COMMUNITY RESEARCH LAB Training community groups to lead and sustain action-oriented research & technology projects …is an information + action resource that unites rigorous research, community voices and innovative technologiesto solve the root causes of social inequity
HealthyCity.org is a statewide resources that enables you to: • Find community resources and partners • Map, Chart & Rank community data • Upload data & Share your community’s story
Case Manager Funder Service Provider HealthyCity.org Website Community Organizer Policy Advocate Researcher …to fuel social change and improve our communities Who Uses HealthyCity.org? Grant Writer
Find data for your community to assess the past, present and future. Create maps that visually communicate your advocacy message to impact policy decisions. Upload & map data that you collect in order to see the distribution of your clients, members, facilities, or other organizations. Access additional features with a free Healthy City account. Today you will learn how to:
1. Find data: You’re part of a BHC and want to find data about your community
Click on Change to select your geography
Choose a sub-category
Select a different indicator Births in Fresno County: 2,044 births were to Mothers under age 20 which was about 12.99% of total births
Ability to view different types of charts Shortcut to map of this data
Click Show/Hide description to see details Universe, Source, Year Click Show/Hide List to see data level used for aggregation
Click Show/Hide List to see list of geographies used to aggregate
Data Sources on HealthyCity.org And many more…
Data Source Tips for Trending Data Key Points to Keep in Mind: • How old is the data? • At what data level/geography is it available? • How frequently is it updated? • How complete is the data? • What are the pros and cons for a specific dataset?
ACS v. Census ACS • 1-year, 3-year, 5-year estimates • Data Level: Census Tract, City, County, Congressional District State • Has margins of error • Detailed demographic, housing, financial, social data • Free Census • Every 10 years • Data Level: Census Block thru State • No margins of error • Basic population and housing data • Free
Learn about our point data
Data Visualizations Pie charts are useful for showing significant differences in percentages as parts of a whole. *Remember—values need to add up to 100% Line graphs are useful for showing changes over time. Bar graphs are useful for comparing data between different groups.
Finding Data Questions?
2. Create maps that visually communicate your advocacy message to impact policy decisions
Click on Change to select your geography