Download
1 / 2
20 likes | 208 Vues
Fig.1 Temperature + precipitation changes (annual) and relative PDSI for 2070-99 (w.r.t. 1991-2020) (7 GCMs):. TEMP. PREC. rPDSI. CSIRO. CGCM. ECHAM. GFDL. HadCM. CCSR. III. Combining information from 7 GCMs

E N D
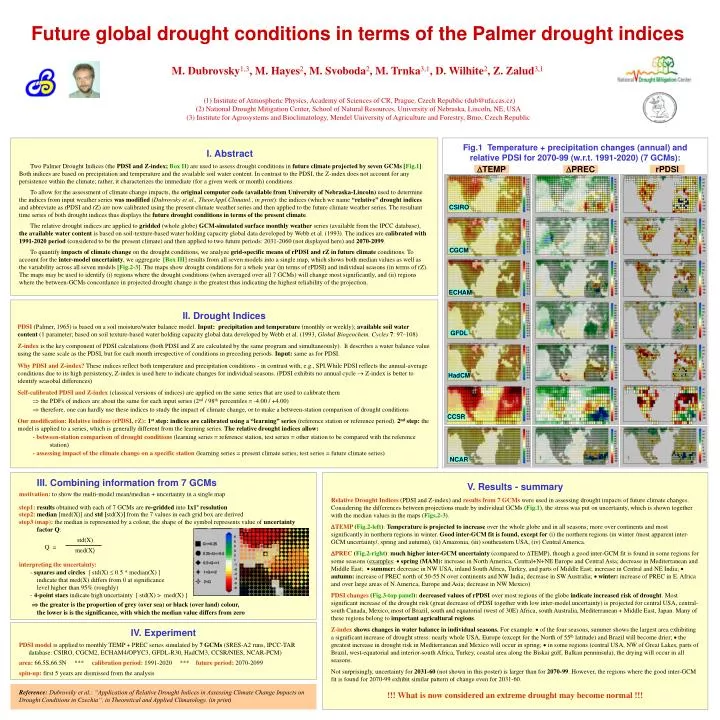
Fig.1 Temperature + precipitation changes (annual) and relative PDSI for 2070-99 (w.r.t. 1991-2020) (7 GCMs): TEMP PREC rPDSI CSIRO CGCM ECHAM GFDL HadCM CCSR III. Combining information from 7 GCMs motivation: to show the multi-model mean/median + uncertainty in a single map step1:results obtained with each of 7 GCMs are re-gridded into 1x1º resolution step2:median [med(X)] and std [std(X)] from the 7 values in each grid box are derived step3 (map):the median is represented by a colour, the shape of the symbol represents value of uncertainty factor Q: Q = interpreting the uncertainty: - squares and circles [ std(X) 0.5 * median(X) ] indicate that med(X) differs from 0 at significance level higher than 95% (roughly) - 4-point stars indicate high uncertainty [ std(X) > med(X) ] the greater is the proportion of grey (over sea) or black (over land) colour, the lower is is the significance, with which the median value differs from zero NCAR std(X) med(X) Future global drought conditions in terms of the Palmer drought indices M. Dubrovsky1,3, M. Hayes2, M. Svoboda2, M. Trnka3,1, D. Wilhite2, Z. Zalud3,1 (1) Institute of Atmospheric Physics, Academy of Sciences of CR, Prague, Czech Republic (dub@ufa.cas.cz) (2) National Drought Mitigation Center, School of Natural Resources, University of Nebraska, Lincoln, NE, USA (3) Institute for Agrosystems and Bioclimatology, Mendel University of Agriculture and Forestry, Brno, Czech Republic I. Abstract Two Palmer Drought Indices (the PDSI and Z-index; Box II) are used to assess drought conditions in future climate projected by seven GCMs [Fig.1]. Both indices are based on precipitation and temperature and the available soil water content. In contrast to the PDSI, the Z-index does not account for any persistence within the climate; rather, it characterizes the immediate (for a given week or month) conditions. To allow for the assessment of climate change impacts, the original computer code (available from University of Nebraska-Lincoln) used to determine the indices from input weather series was modified (Dubrovsky et al., Theor.Appl.Climatol., in print): the indices (which we name “relative” drought indices and abbreviate as rPDSI and rZ) are now calibrated using the present climate weather series and then applied to the future climate weather series. The resultant time series of both drought indices thus displays the future drought conditions in terms of the present climate. The relative drought indices are applied to gridded (whole globe) GCM-simulated surface monthly weather series (available from the IPCC database), the available water content is based on soil-texture-based water holding capacity global data developed by Webb et al. (1993). The indices are calibrated with 1991-2020 period (considered to be the present climate) and then applied to two future periods: 2031-2060 (not displayed here) and 2070-2099. To quantify impacts of climate change on the drought conditions, we analyze grid‑specific means of rPDSI and rZ in future climate conditions. To account for the inter-model uncertainty, we aggregate [Box III] results from all seven models into a single map, which shows both median values as well as the variability across all seven models [Fig.2-3]. The maps show drought conditions for a whole year (in terms of rPDSI) and individual seasons (in terms of rZ). The maps may be used to identify (i) regions where the drought conditions (when averaged over all 7 GCMs) will change most significantly, and (ii) regions where the between‑GCMs concordance in projected drought change is the greatest thus indicating the highest reliability of the projection. • II. Drought Indices PDSI(Palmer, 1965) is based on a soil moisture/water balance model. Input: precipitation and temperature (monthly or weekly); available soil water content (1 parameter; based on soil texture‑based water holding capacity global data developed by Webb et al. (1993, Global Biogeochem. Cycles7: 97–108) Z-indexis the key component of PDSI calculations (both PDSI and Z are calculated by the same program and simultaneously). It describes a water balance value using the same scale as the PDSI, but for each month irrespective of conditions in preceding periods. Input: same as for PDSI. Why PDSI and Z-index?These indices reflect both temperature and precipitation conditions - in contrast with, e.g., SPI.While PDSI reflects the annual-average conditions due to its high persistency, Z-index is used here to indicate changes for individual seasons. (PDSI exhibits no annual cycle Z-index is better to identify seasobal differences) Self-calibrated PDSI and Z-index (classical versions of indices) are applied on the same series that are used to calibrate them the PDFs of indices are about the same for each input series (2nd / 98th percentiles = -4.00 / +4.00) therefore, one can hardly use these indices to study the impact of climate change, or to make a between-station comparison of drought conditions Our modification: Relative indices (rPDSI, rZ):1st step:indices are calibrated using a “learning” series (reference station or reference period). 2nd step: the model is applied to a series, which is generally different from the learning series. The relative drought indices allow: • - between-station comparison of drought conditions (learning series = reference station, test series = other station to be compared with the reference station) • - assessing impact of the climate change on a specific station (learning series = present climate series; test series = future climate series) V. Results - summary Relative Drought Indices (PDSI and Z-index) and results from 7 GCMs were used in assessing drought impacts of future climate changes. Considering the differences between projections made by individual GCMs (Fig.1), the stress was put on uncertainty, which is shown together with the median values in the maps (Figs.2-3). TEMP (Fig.2-left):Temperature is projected to increase over the whole globe and in all seasons; more over continents and most significantly in northern regions in winter. Good inter-GCM fit is found, except for (i) the northern regions (in winter /most apparent inter-GCM uncertainty/, spring and autumn), (ii) Amazonia, (iii) southeastern USA, (iv) Central America. PREC (Fig.2-right):much higher inter-GCM uncertainty (compared toTEMP), though a good inter-GCM fit is found in some regions for some seasons (examples: spring (MAM): increase in North America, Central+N+NE Europe and Central Asia; decrease in Mediterranean and Middle East; summer: decrease in NW USA, inland South Africa, Turkey, and parts of Middle East; increase in Central and NE India; autumn: increase of PREC north of 50-55 N over continents and NW India; decrease in SW Australia; winter: increase of PREC in E. Africa and over large areas of N.America, Europe and Asia; decrease in NW Mexico) PDSI changes (Fig.3-top panel):decreased values of rPDSI over most regions of the globe indicate increased risk of drought. Most significant increase of the drought risk (great decrease of rPDSI together with low inter-model uncertainty) is projected for central USA, central-south Canada, Mexico, most of Brazil, south and equatorial (west of 30E) Africa, south Australia, Mediterranean + Middle East, Japan. Many of these regions belong to important agricultural regions. Z-index shows changes in water balance in individual seasons. For example: of the four seasons, summer shows the largest area exhibiting a significant increase of drought stress: nearly whole USA, Europe (except for the North of 55th latitude) and Brazil will become drier; the greatest increase in drought risk in Mediterranean and Mexico will occur in spring; in some regions (central USA, NW of Great Lakes, parts of Brazil, west-equatorial and interior-south Africa, Turkey, coastal area along the Biskai gulf, Balkan penninsula), the drying will occur in all seasons. Not surprisingly, uncertainty for 2031-60 (not shown in this poster) is larger than for 2070-99. However, the regions where the good inter-GCM fit is found for 2070-99 exhibit similar pattern of change even for 2031-60. !!! What is now considered an extreme drought may become normal !!! IV. Experiment PDSI model is applied to monthly TEMP + PREC series simulated by 7 GCMs (SRES-A2 runs, IPCC-TAR database: CSIRO, CGCM2, ECHAM4/OPYC3, GFDL-R30, HadCM3, CCSR/NIES, NCAR-PCM) area: 66.5S,66.5N *** calibration period: 1991-2020 *** future period: 2070-2099 spin-up: first 5 years are dismissed from the analysis Reference: Dubrovsky et al.: “Application of Relative Drought Indices in Assessing Climate Change Impacts on Drought Conditions in Czechia”. in Theoretical and Applied Climatology. (in print)
Fig.3 Relative drought indices in 2070-2099 (calibration period = 1991-2020) based on 7 GCMs rPDSI: annual means; rZ: seasonal means Fig.2 Climate change scenario (2070-2099) wrt (1991-2020) based on 7 GCMs TEMP PREC year year rPDSI: annual mean winter (DJF) rZ: winter winter (DJF) rZ: spring spring (MAM) spring (MAM) summer (JJA) rZ: summer summer (JJA) autumn (SON) autumn (SON) rZ: autumn acknowledgements: The study is supported by the National Agency for the Agricultural Research (project QG60051) and the AMVIS-KONTAKT project (ME 844) *** this poster:www.ufa.cas.cz/dub/impacts/2008-egu-drought-martin.pdf *** more our papers and presentations:www.ufa.cas.cz/dub/crop/crop.htm ***