Download
1 / 89
910 likes | 1.16k Vues
Scale and Complexity in Environmental Systems. Daniel A. Vallero, Ph.D. National Exposure Research Laboratory U.S. Environmental Protection Agency. Systematic mandates from NEPA: EIS CEQ. Environmental Protection: A Child of the ’60s. Scale is crucial. Regulatory Focus Varies. Policy

E N D
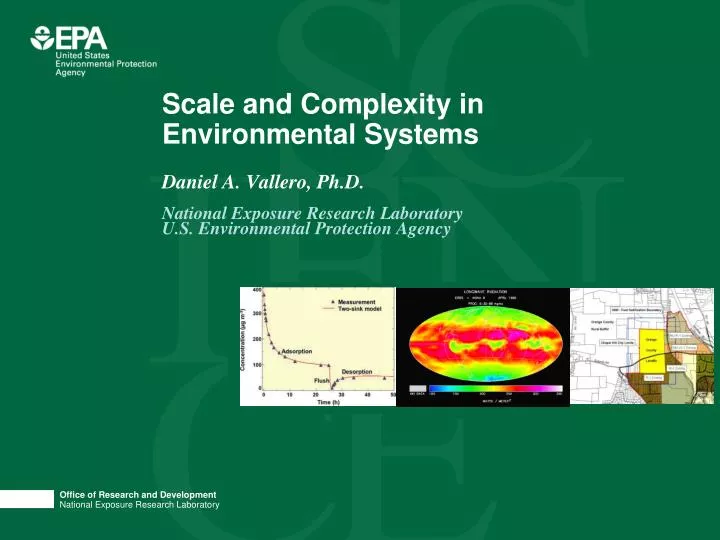
Scale and Complexity in Environmental Systems Daniel A. Vallero, Ph.D. National Exposure Research Laboratory U.S. Environmental Protection Agency
Systematic mandates from NEPA: • EIS • CEQ Environmental Protection: A Child of the ’60s
Regulatory Focus Varies • Policy • National consistency • Command and control • Technology (Clean Air Act in the 1990s) • Risk • Assessment (science) • Management (policy) • Communication (everything) • Residual risk (Clean Air Act now) • Safe products (TSCA/FIFRA) • Health based standards (Clean Water and Safe Drinking Water Acts) • Manifests (RCRA, Right to Know) • Response (Superfund, Contingency Plan, Spill Response…)
Mission of Engineers(Adapted from: Department of Materials Science and Engineering, State University of New York at Stony Brook) • The engineer must envision and allow for the creation of something, following certain specifications, which performs a given function. • What we design must perform its function without fail.
But eventually, everything fails… • So, designers must strive to avoid failure, in all of its forms. • In particular, we must avoid catastrophic failures: • loss of designed property or properties potentially affected by the application of the design; • damage to the environment where the design is applied, and; • Most importantly injury and loss of life. • Modern designers can learn what to do and NOT to do to create designs with less of a chance of failure.
Example of Range of Acceptability • Design of a barrier under a waste facility may reduce the flow of water carrying hazardous materials to 10-9 m s –1
Design Success Contaminants Contaminants Water Table
Example of Range of Acceptability • Design of a barrier under a waste facility may reduce the flow of water carrying hazardous materials to 10-9 m s –1 • But, it does not eliminate the flow entirely • The designer must keep the flow rate low
Design Success Contaminants Water Table Contaminants
Example of Range of Acceptability • Design of a barrier under a waste facility may reduce the flow of water carrying hazardous materials to 10-9 m s –1 • But, it does not eliminate the flow entirely • The designer must keep the flow rate low • Catastrophic failure at Q = 10-2 m s –1!
Perception is crucial • Which line is longer? The Müller-Lyer Illusion.
Perception is crucial • Which line is longer? The Müller-Lyer Illusion.
Perception is crucial • Which line is longer? The Müller-Lyer Illusion.
Perception is crucial • Which line is longer? The Müller-Lyer Illusion.
Perception is crucial • Which line is longer? The Müller-Lyer Illusion.
Perception is crucial • Which line is longer? The Müller-Lyer Illusion.
But sometimes, perception is pretty accurate…. Source: Pardon, ca. 1970.
Risk Perception • Failures become "disasters" as a function of public perception of risk. • For example, in 1992, same number of U.S. fatalities in transportation accidents involving airplanes (775), trains (755), and bicycles (722). • Public perception of the risk from air travel is often much higher than that for trains and bicycles. • Two apparent reasons: • large loss of life and associated media attention from an air crash, and • air passenger's lack of control over their environment in the case of air or, to a lesser degree, rail accidents. • But there are many reasons behind these perceptions
Report Report Report Report Report Report Report Report Report Data Reduction Interpretation (Information) True Meaning (Signal) Data Risk Communication S/N = ∞ Noise ? S/N = Low
Different Processes at Work* *Adapted from K. Smith, 1992
Risk is quantifiable ... Risk = f(Hazard x Exposure) • A probability, a fraction • Part of our everyday lives • Different for each of us • Basis for decision-making
Risk Assessment Defined: Risk assessment is a process where information is analyzed to determine if an environmental hazard might cause harm to exposed persons and ecosystems. Paraphrased from the “Risk Assessment in the Federal Government”(National Research Council, 1983)
A few words about toxicity and uncertainty in scale • Cancer versus non-cancer • Cancer uses slope factor • Non-cancer uses reference dose (RfD) or reference concentration (RfC) • RfC is for air, RfD for other exposure pathways • No safe level of exposure to a carcinogen (no threshold, no NOAEL)
A C Adverse Effect B B Dose NOAEL Dose-Response: A Way to Define a Hazard
Cancer Dose-Response: No threshold for cancer Non-cancer Adverse Effect Dose NOAEL
NOAEL MFUF RfD = Dose-Response: Safety in Reference Dose Adverse Effect Dose NOAEL
NOAEL MFUF RfD = Dose-Response: Safety in Reference Dose Adverse Effect RfD Dose NOAEL
NOAEL MFUF RfD = Improved Certainty Includes Better Scale and Complexity Factors Adverse Effect RfD RfD Dose NOAEL
Calculating Exposures: Amount of Hazard Reaching Us • Where, • E = personal exposure during time period from t1 to t2 • C(t) = concentration at interface, at t.
Where, • E = personal exposure during time period from t1 to t2 • C(t) = concentration at interface, at t. Exposure bridges the physical and social sciences Chemistry & Physics Psychology & Sociology
SOURCE / STRESSOR Transport, DISEASE FORMATION Transformation & Fate Models Cancer Chemical Asthma Physical Infertility Microbial TRANSPORT / ALTERED STRUCTURE / etc. Magnitude TRANSFORMATION FUNCTION Duration Timing Edema Dispersion Arrhythmia Kinetics Themodynamics Enzymuria PBPK ENVIRONMENTAL EARLY BIOLOGICAL Distributions Necrosis CHARACTERIZATION EFFECT Models Meteorology etc. Exposure Air Molecular Models Water Biochemical Diet Cellular Soil & dust Organ DOSE Organism Absorbed EXPOSURE Target Internal Activity Pathway • Individual Biologically Effective Patterns Route • Community Duration • Population Frequency Magnitude Statistical Profile Reference Population Susceptible Individual Susceptible Subpopulations Population Distributions • Components of Exposure Science • Measurements (Orange Boxes) • Models (Green Lines)
Linking Human and Exposure Analysis for a Single Contaminant (Mangis et al.) Environmental Measurements & Modeling Deposition to aquatic ecosystem M0, M2+ M-CxHy Speciation
Linking Human and Exposure Analysis for a Single Contaminant Environmental Measurements & Modeling Deposition to aquatic ecosystem M0, M2+ M-CxHy Speciation Ecosystem function & structure Food Chain Uptake Activity and Function Measurements & Modeling
Linking Human and Exposure Analysis for a Single Contaminant Environmental Measurements & Modeling Atmospheric emissions Natural: Forest fires, volcanoes Industrial: Power plants Deposition to aquatic ecosystem Ground water transport Natural & industrial sources M0, M2+ M-CxHy Speciation Ecosystem function & structure Food Chain Uptake Activity and Function Measurements & Modeling • Temporal Variability • Uncertainties: • Intra-annual • Inter-annual • Fish species • Fish maturation • Fish size etc. • Population Diet • Uncertainties: • Amounts consumed • Fish species consumed • Fish preparation etc. • Regional Economy • Uncertainties: • Local vs. imported fish • Pricing and availability • Processing, storage etc.
Linking Human and Exposure Analysis for a Single Contaminant Environmental Measurements & Modeling Atmospheric emissions Natural: Forest fires, volcanoes Industrial: Power plants Deposition to aquatic ecosystem Ground water transport Natural & industrial sources M0, M2+ M-CxHy Speciation Ecosystem function & structure Food Chain Uptake Activity and Function Measurements & Modeling • Population Diet • Uncertainties: • Amounts consumed • Fish species consumed • Fish preparation etc. • Regional Economy • Uncertainties: • Local vs. imported fish • Pricing and availability • Processing, storage etc. • Temporal Variability • Uncertainties: • Intra-annual • Inter-annual • Fish species • Fish maturation • Fish size etc. Dietary Ingestion
Ground water transport Natural & industrial sources • Temporal Variability • Uncertainties: • Intra-annual • Inter-annual • Fish species • Fish maturation • Fish size etc. Linking Human and Exposure Analysis for a Single Contaminant Atmospheric emissions Natural: Forest fires, volcanoes Industrial: Power plants Environmental Measurements & Modeling Deposition to aquatic ecosystem M0, M2+ M-CxHy Speciation Ecosystem function & structure Food Chain Uptake • Population Diet • Uncertainties: • Amounts consumed • Fish species consumed • Fish preparation etc. Activity and Function Measurements & Modeling • Regional Economy • Uncertainties: • Local vs. imported fish • Pricing and availability • Processing, storage etc. Dietary Ingestion • Absorption, Distribution Metabolism, Elimination and Toxicity (ADMET) Modeling • Uncertainties: • Age, gender, lifestyle differences • Physiological variability • Physicochemical and biochemical variabilities • Health status, activities • Pregnancy/nursing • Genetic susceptibilities Biomarkers & Eco-Indicators Toxicity/Adverse Effect Neurological Renal Cardiovascular [Genomic / Cytomic] Target Tissue Dose Brain Kidney Breast milk Fetus / fetal brain PBTK and BBDR Modeling
Ground water transport Natural & industrial sources • Temporal Variability • Uncertainties: • Intra-annual • Inter-annual • Fish species • Fish maturation • Fish size etc. LOOKING BACK: RECONSTRUCTION Atmospheric emissions Natural: Forest fires, volcanoes Industrial: Power plants Environmental Measurements & Modeling Deposition to aquatic ecosystem M0, M2+ M-CxHy Speciation Ecosystem function & structure Food Chain Uptake • Population Diet • Uncertainties: • Amounts consumed • Fish species consumed • Fish preparation etc. Activity and Function Measurements & Modeling • Regional Economy • Uncertainties: • Local vs. imported fish • Pricing and availability • Processing, storage etc. Dietary Ingestion • Absorption, Distribution Metabolism, Elimination and Toxicity (ADMET) Modeling • Uncertainties: • Age, gender, lifestyle differences • Physiological variability • Physicochemical and biochemical variabilities • Health status, activities • Pregnancy/nursing • Genetic susceptibilities Biomarkers & Eco-Indicators Toxicity/Adverse Effect Neurological Renal Cardiovascular [Genomic / Cytomic] Target Tissue Dose Brain Kidney Breast milk Fetus / fetal brain PBTK and BBDR Modeling
Advances in the Bayesian Network Applications • Usually, limited available data • And, limited resources • Need reliable information for human and eco decision making • Need a predictive link between actions & results (eco & health)
Typical Approach • Models try to combine understanding from many projects into one predictive framework • Simulating all physical, chemical and biological processes at some state • Highly variable interrelationships among these processes • So, probably better to tailor each relationship’s detail than to choose a scale identical for all processes.
Bayesian Networks • When data and resources are limited… • Graphical structure represents cause-and-effect assumptions between system variables • Such assumptions let causal chain from actions to eco and human consequences to be factored into sequence of conditional probabilities
Rate of contaminant Rate of contaminant Contaminant Contaminant Fluid/matrix Fluid/matrix release release characteristics characteristics characteristics characteristics Instantaneous Instantaneous Probability Probability Probability Probability Probability Probability Value (e.g., rate of Value (e.g., rate of Value (e.g., flow Value (e.g., flow Time Time destruction, uptake) destruction, uptake) rate, partitioning) rate, partitioning) Transport, Transformation, and Fate Transport, Transformation, and Fate Characterization of Contaminant Characterization of Contaminant Water (Ground & Water (Ground & Soil Soil Sediment Sediment Air Air Surface) Surface) Biota Biota Predicted mass or Predicted mass or Predicted mass or Predicted mass or Predicted mass or Predicted mass or Predicted mass or Predicted mass or Predicted mass or Predicted mass or concentration concentration concentration concentration concentration concentration concentration concentration concentration concentration Confidence interval Confidence interval Residence time Residence time Residence time Residence time Residence time Residence time Residence time Residence time Residence time Residence time Characteristics of human Characteristics of human Characteristics of Characteristics of Human Exposure Human Exposure Ecological Exposure Ecological Exposure populations (e.g., activity populations (e.g., activity target organisms, target organisms, patterns, sensitivities, diet, patterns, sensitivities, diet, Factors and Algorithms Factors and Algorithms Factors and Algorithms Factors and Algorithms habitats habitats residential structures) residential structures) Organism Organism Population Population characteristics characteristics characteristics characteristics Probability Probability Probability Probability Eco Eco - - Exposure Exposure Human Exposure Human Exposure Assessment Assessment Assessment Assessment Value (e.g., uptake) Value (e.g., uptake) Value (e.g., activities) Value (e.g., activities) Dose Dose Time Time Bayes Theorem allows myriad forms of information like this to be combined:
Posterior (integrating modeling and monitoring) Sample (monitoring data) Prior (model forecast) Criterion Concentration BayesianAnalysis: Combining Information
Log(chla)=-.95+1.5Log(P) Log chl a Std. Err. = .120 Log P Consequences of actions on ecosystem and human exposure can be predicted. Prior Bayes Theorem Sample Lake Posterior Probability
Bayes (Probability) Networks These are conditional probability models that: • can be mechanistic, statistical, judgmental • use probability to express uncertainty • use Bayes theorem for adaptive implementation updating.
Nitrogen Inputs Cause and Effect Relationships Algal Density Chlorophyll Violations River Flow Carbon Production Harmful Algal Blooms Sediment Oxygen Demand Frequency of Hypoxia Duration of Stratification Shellfish Abundance Fish Health Number of Fishkills
Nitrogen Inputs Algal Density Chlorophyll Violations Carbon Production River Flow Harmful Algal Blooms Sediment Oxygen Demand Frequency of Hypoxia Duration of Stratification Shellfish Abundance Number of Fishkills Fish Health Dependencies are described by conditional probability distributions. p(Hypoxia |SOD, Strat.)
Nitrogen Inputs Algal Density Chlorophyll Violations Carbon Production River Flow Harmful Algal Blooms Sediment Oxygen Demand Frequency of Hypoxia Duration of Stratification Shellfish Abundance Number of Fishkills Fish Health Each conditional distribution can be represented by a separate sub-model. All model relationships can be disaggregated into a series of conditional distributions. p(R) p(C|N) = p(C|A) p(A|N,R)
Nitrogen Inputs Algal Density Chlorophyll Violations Carbon Production River Flow Harmful Algal Blooms Sediment Oxygen Demand Frequency of Hypoxia Duration of Stratification Shellfish Abundance Number of Fishkills Fish Health Empirical Model Site-Specific Application Cross-System Comparison Seasonal Regression Expert Elicitation Simple Mechanistic Survival Model