Download
1 / 16
160 likes | 275 Vues
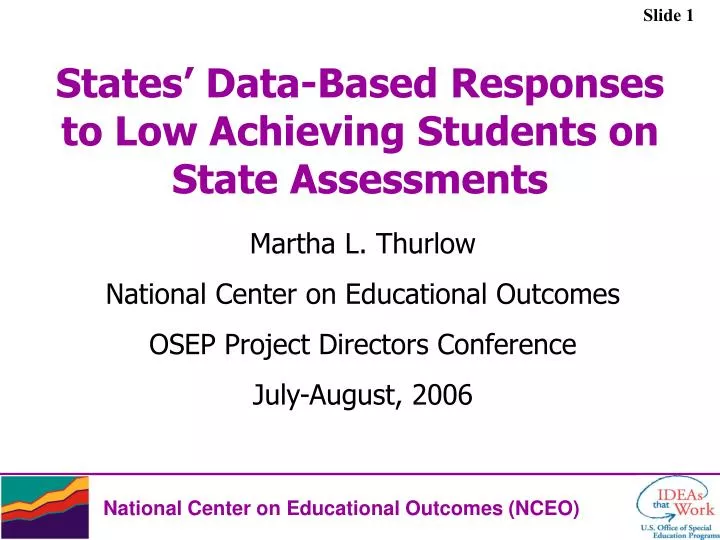
States’ Data-Based Responses to Low Achieving Students on State Assessments. Martha L. Thurlow National Center on Educational Outcomes OSEP Project Directors Conference July-August, 2006. Percent of Students who earned a Competency Determination - Class of 2003. 12 %pts. 17 %pts.

E N D
States’ Data-Based Responses to Low Achieving Students on State Assessments Martha L. Thurlow National Center on Educational Outcomes OSEP Project Directors Conference July-August, 2006
Percent of Students who earned a Competency Determination - Class of 2003 12 %pts 17 %pts 25 %pts 32 %pts 38 %pts 47 %pts
Percent of Special Education Students Attaining the Competency Determination (through the May 2004 MCAS)
Student Performance on Alternate Assessments is Improving Portfolios that scored “Progressing” 76% 68% 61% 34% 12% 2001 2002 2003 2004 2005 MCAS-Alternate Assessment
States Ask QuestionsExamples of Actual State Questions • Are special education students the state’s low performing students? • Are most low performing students in special education? • What do we know about the characteristics of students “in the gap”? What are the implications of all of these – for assessments and instruction?
Are special education students the state’s low performing students? • No – special education students are represented at all scale scores in the distribution • Are most low performing students in special education? • No – many general education students are found in the lowest scoring three percent of students
State Study of Low Performing Students • Some students known as “Students in the Gap” are not served well by Colorado’s current assessment system in that they score poorly and fail to demonstrate longitudinal growth, and thus these tests may not be the best way to measure their knowledge of state content standards. • The passage of HB 05-1246 created a committee to examine and evaluate the impact of the assessments on these “Students in the Gap.” The outcomes of the study were revealing –
Low Performance • 1637 IEP students scored in the lowest 1/3 of Unsatisfactory in Reading and 4332 in Math. Not Low Performance • 117 IEP students earned perfect scores on CSAPA in Reading/Writing and 16 in Math.
250 students (of 444,407) across grade levels were determined to be “students in the gap” on the CSAP Reading Test. • 659 students (of 444,910) across grade levels were determined to be “students in the gap” on the CSAP Math Test. This group represents fewer than 1000students; the group believed that CSAP as currently administered may not reflect these students’ academic achievements; however, if appropriate accommodations and more intensive instruction were provided, these students too might make more gains.
Other Findings: • Bottom 1/3 of scale scores on CSAP is almost twice as likely to be Black or Hispanic students as students scoring higher. • For IEP students scoring in bottom one-third of scale scores, and where a match the following year was able to be made (only 60%), substantial longitudinal growth occurred from one year to the next.
Evidence-Based Practices Donahue Institute Study (University of Massachusetts) Study identified urban districts and schools that demonstrated better than expected MCAS achievement among students with special needs
Donahue Institute Study Practices identified as central to the success of urban districts and schools for special education students • Pervasive emphasis on curriculum alignment with the MA frameworks • Effective systems to support curriculum alignment • Emphasis on inclusion and access to the curriculum
Donahue Institute Study Practices central to the success of urban districts and schools • Culture and practices that support high standards and student achievement • Well disciplined academic and social environment • Use of student assessment data to inform decision making
Donahue Institute Study Practices central to the success of urban districts and schools • Unified practice supported by targeted professional development • Access to resources to support key initiatives • Effective staff recruitment, retention, and deployment
Donohue Institute Study Practices central to the success of urban districts and schools • Flexible leaders and staff that work effectively in a dynamic environment • Effective leadership is essential to success