Download
1 / 37
370 likes | 553 Vues
Water Year 2011: Review of Water Supply Forecasts in the Colorado River Basin. CRFS November 8 , 2011. Green River Basin. Upper Green. Slightly above normal seasonal precipitation through March 2011 Sustained cool and wet period April-June

E N D
Water Year 2011:Review of Water Supply Forecastsin the Colorado River Basin CRFS November 8, 2011
Green River Basin Upper Green • Slightly above normal seasonal precipitation through March 2011 • Sustained cool and wet period April-June • Runoff delayed (especially to the north and west) • Many record or near records for precipitation, runoff volumes, etc Yampa Duchesne
Upper GreenBasin Conditions 160 % 120 % 115 % • Two new records for April-July volume at points coming off the north slope of the Uintas.
FONTENELLE RESERVOIR 1222 KAF 142%
FLAMING GORGE 1926 KAF 162% #1:1986 #2:1983 #3: 2011
FLAMING GORGE LOCAL…….. RECORD! RECORD! 202 KAF 212% 64 KAF 221% ~2.0in ~1.5in ~3.0in ~1.5in
DuchesneBasin Conditions • 10/16 forecast points set records for April-July volume.
158 268%
YampaBasin Conditions • Record Snowpack • All forecast points set records for April-July volume.
1988 201%
881 241%
Green River Basin Records RED=Single Month Volume > April-July Average *POR after regulation White/Yampa=10 /10 Duchesne=10/16
Upper Colorado Basin • Slightly above normal seasonal precipitation through March 2011 • Sustained cool and wet period April-June • Many record or near records for precipitation, runoff volumes, etc • Precipitation and runoff volumes greater to the north (e.g. Granby, Dillon, etc) and less to the south (e.g. Gunnison) and still less in the Dolores Mainstem Gunnison Dolores
Upper Colorado MainstemBasin Conditions As of July 1, 2011 As of August 1, 2011
428 190% Record Runoff 343 (1984) 225
4489 (1984) 4200 174% 2420
893 124%
131 127% 125 123% 125 123%
275 86%
San Juan Basin • Near to Below normal year • Evidence of La Nina
579 75%
168 82% 45 78%
431 98%
Historical Observed Apr-Jul Volumes (kaf) 1970-2010 (winter ENSO status) ( 1) - 1984 - 15406.41 (neutral) ( 2) - 1983 - 14838.93 (el nino) ( 3) - 1986 - 12601.21 (neutral) ( 4) - 1995 - 11833.18 (el nino) ( 5) - 1985 - 11701.11 (la nina) ( 6) - 1997 - 11320.89 (neutral) ( 7) - 1973 - 11262.74 (el nino) ( 8) - 1979 - 11104.25 (neutral) ( 9) - 1980 - 10606.60 (neutral) ( 10) - 1993 - 9984.42 (neutral) ( 11) - 1975 - 9953.16 (la nina 2) ( 12) - 2008 - 8908.50 (la nina) ( 13) - 2005 - 8844.02 (el nino) ( 14) - 1978 - 8678.09 (el nino 2) ( 15) - 1998 - 8510.14 (el nino) ( 16) - 1982 - 8210.63 (neutral) ( 17) - 1971 - 8180.35 (la nina) ( 18) - 1970 - 8037.76 (neutral) ( 19) - 2009 - 7806.72 (neutral) ( 20) - 1999 - 7788.09 (la nina) ( 21) - 1987 - 7758.54 (el nino) ( 22) - 1996 - 7233.47 (la nina) ( 23) - 1974 - 6915.13 (la nina) ( 24) - 2010 - 5795.43 (el nino) ( 25) - 1972 - 5494.26 (neutral) ( 26) - 2006 - 5319.56 (neutral) ( 27) - 1976 - 5297.75 (la nina 3) ( 28) - 1991 - 5159.33 (el nino) ( 29) - 1988 - 4567.47 (el nino 2) ( 30) - 2000 - 4367.05 (la nina 2) ( 31) - 2001 - 4320.62 (la nina 3) ( 32) - 1992 - 4124.42 (neutral) ( 33) - 2007 - 4053.47 (el nino) ( 34) - 2003 - 3910.17 (el nino) ( 35) - 1994 - 3766.48 (neutral) ( 36) - 2004 - 3542.00 (neutral) ( 37) - 1989 - 3524.63 (la nina) ( 38) - 1990 - 3228.85 (neutral) ( 39) - 1981 - 3058.61 (neutral) ( 40) - 1977 - 1277.39 (el nino) ( 41) - 2002 - 1126.76 (neutral) Lake Powell 2011 – 12,920 (la nina) 3rd highest April-July volume since the closure of the dam
15.7 (1917) 12.9 maf 163% 7.9
6490 205% 12.9 163% 6894 148% 888 72%
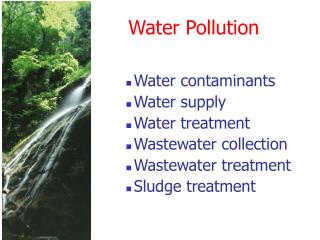
Lower Colorado Basin • Much below average except in northwest (e.g. Virgin, Muddy, etc) • Virgin: • December 2010 storm track was important, but also wet April-May. • Snowpack persisted due to cool temperatures, melt delayed. Virgin Phoenix dust storm
149 217%
Pre Holiday Storm: • Lake Mead up ~2 feet from local runoff • Large snow accumulation