Download
1 / 36
390 likes | 507 Vues
Sorting, Printing, and Summarizing Your Data (Chapter in the 4 Little SAS Book). Animal Science 500 Lecture No. 5 September 14, 2010. Using a Procedure (PROC). Using the procedure statement is like filling out a form You fill in the blanks Choose from the list of options PROC statement

E N D
Sorting, Printing, and Summarizing Your Data(Chapter in the 4 Little SAS Book) Animal Science 500 Lecture No. 5 September 14, 2010
Using a Procedure (PROC) • Using the procedure statement is like filling out a form • You fill in the blanks • Choose from the list of options • PROC statement • All procedures start with this statement • Is followed by the name of the procedure desired (Print, Means, Tabulate, etc.)
PROC statements • If you have many SAS dataset you are using you can specify which dataset you want the procedure to applied to • PROC Contents Data = Pig12; • This statement is optional • If the data statement is not present the Procedure will be applied to the last data set created (not necessarily used).
By statement • The by statement is required for only one Procedure, the PROC Sort • Obviously if you are sorting your data set you want to sort it by some variable contained in your data. • In all other Procedures the by statement is optional.
Title and Footnote statements • Title prints at the top of your output • 10 line limit • Footnote prints at the bottom of your output • 10 line limit • You can place these anywhere you want • Applies to the Procedure you are working with so you might want to just include it in this particular section
Title and Footnote statements • When using the title and footnote statements SAS does not care if you use the single quotes ‘test’ or the double quotes “test” as long as you are consistent. • Do not mix types of quotes
Label statement • The default situation in SAS uses the variable names to label your output • Can create more descriptive labels • Limit up to 256 characters long limit • Example Label = DOT ‘date on test’ ADG = ‘Average Daily Gain’;
Subsetting in Procedures with the Where Statement • The Where statement can be used with almost any PROC statement • The Where statement can be used to subset the data much like an If – Then statement • Advantage for the Where statement • The IF – Then statement only works in the Data step • The Where statement works in both the Data and the Procedure step.
Subsetting in Procedures with the Where Statement • Examples using the Where statement • In the Data step • Where Backfat le .50 backfat group =1; • Where Backfat ge .50 AND le .75 backfat group =2; • Where Backfat ge .75 AND le 1.00 backfat group =3; • Else Backfat group =.; • Run; • Quit;
Subsetting in Procedures with the Where Statement • Examples using the Where statement • In the Proc Step • Where Backfat Group = 1 • Title ‘Leanest Pigs From The Experiment 1’ • Footnote ‘Experimental Pigs with .50 inches of backfat and less’; • Run; • Quit;
Subsetting in Procedures with the PROC Sort Statement • Many reasons to sort your data • Think of examples from labs • You can use the PROC Sort statement with the by option; • In the by statement you can include as many variables as you want • Example – Proc sort; by pen sex trt; • So it would sort by pen, then within pen sort sex and then, within pen and sex sort by treatment; • Often more useful to sort by one variable so that other procedures can be performed.
Subsetting in Procedures with the PROC Sort Statement • The NODUPKEY eliminates duplicate observations that have the same values for the BY variable • Use this with the DUPOUT option • This option will put the deleted observations in new data set • Example • Data sort; by pen; Out = Pig13 NODUPKEY DUPOUT = duplicates;
Subsetting in Procedures with the PROC Sort Statement • Example • Data new Proc sort; by pen; Out = Pig13 NODUPKEY DUPOUT = duplicates; • This is useful for working with field data • DHIA records • Records from Breed Associations (Yorkshire, Landrace, Angus, Hereford, etc.) • How might you find? • Data= name; Proc Sort; by herd id; Out = cleandata NODUPKEY DUPOUT = duplicates;
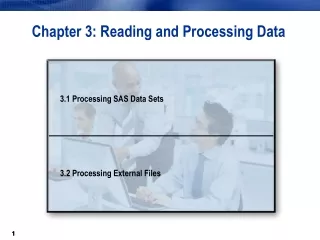
Printing your Data with PROC PRINT • We have used PROC PRINT many times in lab • What is new is that there are several options in SAS associated with the PROC PRINT • Like other statements you can tell SAS what data set to use for printing • PROC PRINT DATA = PIG12
Printing your Data with PROC PRINT • PROC PRINT Data = PIG12 NOOBS LABEL; • The NOOBS results in SAS NOT printing the observation number by each line • Might want the observation number to check counts for some reason so you would omit the NOOBS option • Use the NOOBS because it just takes up space
Printing your Data with PROC PRINT • Variable option used with PROC PRINT • ID statement prints out the IDs rather than the observation number. • Useful to compare a printed list from SAS output to your original data that you have stored electronically or on paper. • The SUM option • This option sums the variable specified • Could be particularly useful when looking at pen weights rather than individual wts. when pen is the experimental unit.
Printing your Data with PROC PRINT • The SUM option • PROC Print Data = Pig 12; by pen; Sum wtgain; VAR ID Pen Sex ADG wtgain; Title ‘Weight Gain Summed by Pens’; RUN; QUIT;
SAS Can be Used to Write Simple Reports • For example you just wanted to summerize the data from Pig12 • Example • Data _Null_; Infile ‘some data file source’; Input variable names; Created variable like ADG; Tell where to put it; File ‘c:\ somefile\data.txt’ Print; Title; Put @5 ‘Sale Report for ‘Name’ from classroom’ Class // @5 ‘Congratulations! You sold ‘ Quantity ’ boses of candy’ / @5 ‘and earned ‘ Profit DOLLAR6.2 ‘ for out field trip.’; Put_PAGE_;
Summarizing Your Data Using PROC MEANS • We have started to use PROC MEANS in LAB; • Numerous options to use with PROC MEANS • Use by including them behind PROC MEANS Option • The default will print the number of non-missing values, the mean, the standard deviation, and the minimum – maximum value for each observation. • The options available include; • Median –the numeric value separating the higher half of a sample • Mode – value occurring most frequently
Summarizing Your Data Using PROC MEANS • Options cont’ • Nmiss – number of missing values by variable • Range – range of values • Sum – the sum • Use the default PROC MEANS; without the var option; • If you do not wish to obtain means for every trait you can indicate which variable means you wish to obtain • PROC MEANS var ADG, Backfat, LMA;
Summarizing Your Data Using PROC MEANS • You can subset the data and obtain means using the by statement • You will get n sets of means depending on how many levels the by variable you sorted by
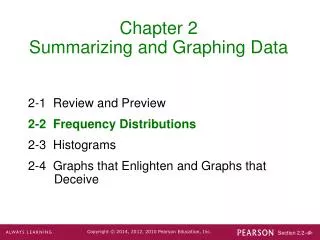
Counting your Data Using PROC FREQ • PROC FREQ • A frequency table gives you simple counts or number of variables you have for each • When you have counts for one variable it is called a one-way frequencies • When you have two or more variables the counts are called two-way, three-way and so forth • Alternatively the multiple variables are called Cross tabulations • Used most frequently to show distribution of data variables • Can be used to identify data irregularities
Counting your Data Using PROC FREQ • Basis form is PROC FREQ; Tables variable – combinations; • Options if any are included after a / after the tables statement i.e. • Tables variable – combinations / list; • The options available are: • List – prints cross-tabulations in list format rather than grid • Missing – Includes missing values in frequency statistics • NOCOL – suppresses printing column percentages in corss-tabulations • NOPERCENT- suppresses printing of percentages • NOROW - suppresses printing row percentages in cross-tabulations • Out = data-set writes a data set containing frequencies
Counting your Data Using PROC FREQ • Options if any are included after a / after the tables statement i.e. • Tables variable – combinations / list; • The options cont’ are: • Chisq - performs the standard Pearson chi-square test on the table(s) requested. • Expected – prints the expected number of observations in each cell under the null hypothesis. • Exact - requests Fisher's exact test for the table(s). This is automatically computed for 2 x 2 tables. • Sparse - produces a full table, even if the table has many cells containing no observations.
Example of Two –Way Contingency Table • Table of hichol1 by hichol2 • hichol1 hichol2 • | 1 | 2 | Total • -----------+-----------+-------- • Frequeny 1 | 21 | 21 | 42 • Percent | 22.83 | 22.83 | 45.65 • -----------+------------+-------- • 2 | 23 | 27 | 50 • | 25.00 | 29.35 | 54.35 • -----------+------------+-------- • Total 44 48 92 • 47.83 52.17 100.00 • Frequency Missing = 2
Using PROC TABULATE • Every summary statistic the TABULATE computes can be produced by other procedures • Print • Means, and • Freq But some people think PROC TABULATE output is much “prettier”.
Using PROC TABULATE • General Form • PROC TABULATE; • CLASS –classification variable list; • TABLE page-dimension, row-dimension, column-dimension CLASS statement tell SAS which variables contain categorical data to be used for dividing the observations into groups • In our example data set this would mean things like test, sex, pen, treatment, breed
Using PROC TABULATE • General Form • PROC TABULATE; • CLASS –classification variable list; • TABLE page-dimension, row-dimension, column-dimension • TABLE statement defines only one table but you might have multiple TABLE statements • If a variable is listed in the CLASS statement, then, by default, PROC TABULATE produces simple counts of the number of observations in each category fo that variable. • PROC TABULATE offers many other statistics too.
Using PROC TABULATE • General Form • PROC TABULATE; • CLASS –classification variable list; • TABLE page-dimension, row-dimension, column-dimension • Each TABLE statement can specify up to 3 dimensions • The dimensions separated by commas , and tell SAS which variables are used for the pages, rows, and columns • Specify one dimension then it becomes the column dimension • Specify two dimensions then they become rows and columns • Specify three dimensions then they become row, columns and pages
Using PROC TABULATE • General Form • PROC TABULATE; • CLASS –classification variable list; • TABLE page-dimension, row-dimension, column-dimension • The default results in observations that are missing are not included in the in the tables • To keep the missing values included in the report then the code PROC TABULATE MISSING; must be used
Example form Generated by PROC TABULATE • PROC TABULATE; • CLASS GENDER; • VAR AGE INCOME EDUC; • TABLE (AGE INCOME EDUC)*MEAN, GENDER ALL; • RUN; • QUIT;
Example form Generated by PROC TABULATE • PROC TABULATE; • CLASS GENDER; • VAR AGE INCOME EDUC; • TABLE (AGE INCOME EDUC)*MEAN, GENDER ALL; • RUN; • QUIT;
Output from a PROC TABULATE example Output 1.1 Variable Label N Mean Std Dev Minimum Maximum -------------------------------------------------------------------------------------------------------------------------- AGE Age 6639 48.614 16.598 25.000 90.000 INCOME Income 6639 25065.797 23850.488 0.000 263253.000 EDUC Education 6639 13.040 2.953 4.000 19.000 --------------------------------------------------------------------------------------------------------------------------
Output from a PROC TABULATE example Output 1.2 GENDER = Female Variable Label N Mean Std Dev Minimum Maximum -------------------------------------------------------------------------------------------------------------------------- AGE Age 3559 49.528 17.158 25.000 90.000 INOME Income 3559 17780.087 17070.596 0.000 263253.000 EDUC Education 3559 12.932 2.899 4.000 19.000 ------------------------------------------------------------------------------------------------------------------------- GENDER = Male Variable Label N Mean Std Dev Minimum Maximum -------------------------------------------------------------------------------------------------------------------------- AGE Age 3080 47.558 15.864 25.000 90.000 INCOME Income 3080 33484.577 27520.481 0.000 251998.000 EDUC Education 3080 13.165 3.011 4.000 19.000 -------------------------------------------------------------------------------------------------------------
Output from a PROC TABULATE example Output 1.3 ------------------------------------------------------------------------------------------------------------------------- | | GENDER | | | |-------------------------------| | | | Female | Male | ALL | |-----------------------------------------------------+---------------+--------------+-------------------------------- | Age MEAN | 49.53 | 47.56 | 48.61 | |-----------------------------------------------------+---------------+--------------+--------------------------------| | Income MEAN | 17780.09 | 33484.58 | 25065.80 | |-----------------------------------------------------+---------------+--------------+--------------------------------| | Education MEAN | 12.93 | 13.17 | 13.04 | -------------------------------------------------------------------------------------------------------------------------