Download
1 / 19
190 likes | 272 Vues
Potential Vorticity (PV) Thinking in Operations: The Utility of Nonconservation. Michael J. Brennan*, Gary M. Lackmann, and Kelly M. Mahoney Department of Marine, Earth, and Atmospheric Sciences, North Carolina State University, Raleigh, North Carolina. Introduction.

E N D
Potential Vorticity (PV) Thinking in Operations: The Utility of Nonconservation Michael J. Brennan*, Gary M. Lackmann, and Kelly M. Mahoney Department of Marine, Earth, and Atmospheric Sciences, North Carolina State University, Raleigh, North Carolina
Introduction • PV can potentially be used by operational forecasters as a tool in the forecast process • PV hasn’t gained widespread acceptance in the operational forecasting community • Goals of the paper • Provide examples of situations where PV diagnosis adds value to traditional forecast methods • Provide specific suggestions for diagnostic PV tools for use in forecasting
Overview of PV Concepts • PV principles • PV is proportional to the product of absolute vorticity and static stability • PV = (1/ρ)η ∙ ▼θ • In the Northern Hemisphere positive PV anomalies are associated with positive relative vorticity and high values of static stability • PV is conserved in frictionless, adiabatic flow • PV is not conserved in diabatic processes
Overview of PV Concepts • PV is invertible • Piecewise inversions can be used to quantify effects of heating and friction influenced developments of specific anomalies by solving a boundary value problem • Davis, C.A., and K.A. Emanuel, 1991: Potential vorticity diagnostics of cyclogenesis. Mon. Wea. Rev., 119, 1929-1953 • Not practical for operational forecasters • Cyclogenesis can occur when a cyclonic circulation associated with an upper-level +PV anomaly extends to the surface creating a surface warm anomaly through advection • Diabatic PV anomalies can play a large role in moisture transport and precipitation distribution
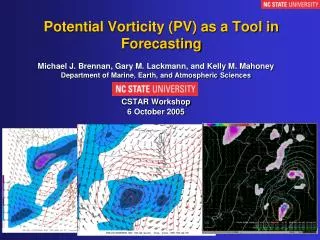
Case Study Examples • Moisture transport in ETC • East coast cyclone of January 24-25, 2000 was poorly forecast by NWP models • A piecewise Ertel PV inversion was used to show that a lower-tropospheric PV maximum, generated by LH in an “incipient precipitation” (IP) area, was critical in moisture transport for the heavy precipitation area • Models did not forecast the IP and therefore were unable to generate the PV maximum responsible for the moisture transport
RUC analysis 0000UTC Jan. 25, 2000 SLP (solid), 800mb wind barbs, 900-700mb PV (shaded PVU). B) 24 hr ETA forecast model. C) RUC SLP (solid), 800mb wind barbs, 800mb moisture flux (shaded g/kg m/s). D) 24 hr ETA forecast
Case Study Examples • Moisture Transport in ETC cont… • ETA model did not forecast the PV maximum and showed little moisture transport compared to RUC analysis • The PV inversion showed that the PV maximum was responsible for 20-25kt of the onshore flow, enhancing the moisture flux • How can this be used? • Overlay lower-tropospheric PV from high-frequency analyses with radar imagery to model QPF and PV forecasts • Evaluate PV forecasts in NWP to diagnose errors • This example shows that a low level PV max can increase the onshore flow poleward of its location causing precipitation to spread farther inland than predicted in NWP models
Case Study Examples • Coastal extratropical cyclogenesis • PV provides a conceptual tool for diagnosing extratropical coastal cyclogenesis • Mahoney and Lackmann found that the model predicted cyclones and fronts were associated with the Betts-Miller-Janjic (BMJ) CP scheme • In this case PV was a useful tracer for monitoring the influence of CP scheme-driven diabatic processes in model forecasts • Workstation version ETA model forecasts using the BMJ CP scheme and the Kain-Fritsch (KP) CP scheme were performed
30 hr forecast BMJ, 900-700mb PV (shaded, PVU), SLP (dashed), 3-h convective precip (solid, mm). b) as in a except 36 hr • c,d) as in a,b except for KP scheme
Case Study Examples • Coastal extratropical cyclogenesis cont… • Results of the forecasts show that the character of the cyclone was very sensitive to the CP scheme used • The differences in model runs can lead to changes in moisture transport and thermal advection • Both are important to forecasters. • How can this be used? • PV can be used as an indicator of intense CP scheme activity • PV maxima can continue after convective precipitation has ended and serve as a tracer of the influence of earlier latent heating • Forecasters should be aware of possible intense CP scheme influence when heavy convective precipitation is collocated with new lower-tropospheric PV maxima
Case study Examples • Low-level jet enhancement • January 13-14, 2005: a slow cold front moved across central and eastern U.S. producing precipitation totals over 25mm, high winds, hail, and tornadoes • At 0600Z a PV maximum developed along a cold frontal rain band, and an LLJ was East of the PV maximum • By 1200Z the PV maximum increased to 1.5 PVU in the heaviest precipitation area and the LLJ increased to 80kt over southern Maine
0600 Jan. 14 2005 900-700mb PV (solid, PVU) and 2km radar mosaic reflectivity
1200 Jan. 14 2005 900-700mb PV (solid, PVU) and 2km radar mosaic reflectivity
0600 Jan. 14, 2005 900-700mb PV (shaded, PVU), 850mb wind barbs, and 850mb isotachs (dashed)
1200 Jan. 14, 2005 900-700mb PV (shaded, PVU), 850mb wind barbs, and 850mb isotachs (dashed)
Case Study Examples • Low-level jet enhancement cont… • A PV budget showed that latent heating associated with the precipitation aided the LL PV maximum development • A quasigeostrophic PV inversion indicated that over 40% of the LLJ was due to the presence of the LL PV anomaly • How can this be used? • Overlaying LL PV, winds, and radar imagery can identify situations when a PV maximum associated with LHR is enhancing a LLJ • Comparing model QPF to short term observations and examining PV distribution can help forecasters determine if models are over or under-estimating LLJ intensity
Operational Tools • New “procedure” for the National Weather Service’s Advanced Weather Interactive Processing System (AWIPS) • Introduced to promote the use of PV in identifying impacts of latent heating in model forecasts • Allows forecasters to examine model forecasts of SLP, LL PV and winds, and total and convective precipitation • Allows users to identify the impact of latent heating on atmospheric dynamics • Met Office developments • Forecasters directly alter model generated PV fields, then use PV inversion to obtain other fields • Forecasters can use PV framework to adjust NWP model guidance which can improve lead times for short and medium-range forecasts
AWIPS: 900-700mb PV (Shaded, PVU), total precip. (blue contours), convective precip. (red contours), 850mb wind barbs, and SLP (white contours)
Conclusions • Using PV to identify and diagnose diabatically produced LL cyclonic PV anomalies gives forecasters a new motive to incorporate PV framework into their forecast methods • PV can be used as a tool along with ensemble forecasts to give more confidence in forecasts of fields with high uncertainties (i.e. QPF) • This forecasting method may gain more acceptance in operational meteorology with further research, enhanced graphical displays, and training modules