Download
1 / 16
160 likes | 273 Vues
Heightened Tropical Cyclone Activity in the North Atlantic: Natural Variability or Climate Trend?. Greg Holland National Center for Atmospheric Research Peter Webster Georgia Tech. Summary: Atlantic Changes and Relationship to SST Issues on Data Reliability. TC1. TC2. TC3.

E N D
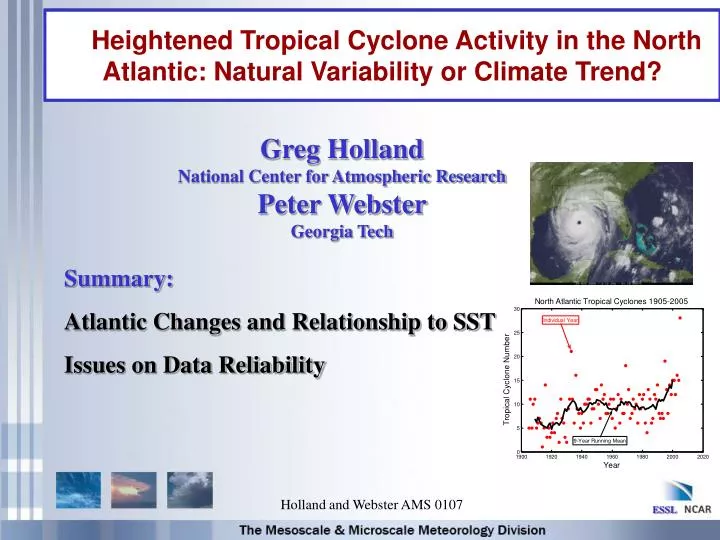
Heightened Tropical Cyclone Activity in the North Atlantic: Natural Variability or Climate Trend? Greg Holland National Center for Atmospheric Research Peter Webster Georgia Tech Summary: Atlantic Changes and Relationship to SST Issues on Data Reliability Holland and Webster AMS 0107
TC1 TC2 TC3 9-year running mean Summary of Past Activity • A marked increasing trend in tropical cyclone frequency closely associated with increasing eastern North Atlantic SSTs, which indicates a substantial contribution by Greenhouse Warming (Holland and Webster 2007); • We emphasize that the SST-TC relationship is not entirely direct, but arises from related atmospheric environmental changes, such as vertical wind shear (e.g. Goldenberg et al 2001; Delworth 2006; Kossin and Vimont 2007). 150% Increase 5-y running mean Holland and Webster AMS 0107
Summary of Past Activity • Stable proportions of hurricanes to all tropical cyclones over the past 50-100 years (the higher earlier proportions are considered due to analysis errors); • Stable major hurricane proportions but with a marked, multi-decadal oscillation (peaks associated with equatorial developments and expansion of the warm pool); • Thus, the numbers of hurricanes and major hurricanes has increased in line with that for all tropical cyclones. Data Issues Holland and Webster AMS 0107
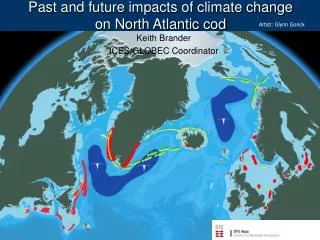
1956-2005 Genesis 1906-1955 Genesis + + - + Where have the Increases Occurred? Increases have occurred in all regions except the western Caribbean and southern Gulf of Mexico, but the largest proportional increases have been in the eastern Atlantic. Holland and Webster AMS 0107
Can Eastern Atlantic trends be due largely to data errors? • There is little doubt that the eastern region was poorly observed in earlier years, but there are other factors; several studies have shown independent relationships, eg: • We have shown a strong and stable relationship between frequency and SSTs; • Kossin and Vitmer (2007) have shown that there is a close relationship between positive phases of the AMM and the eastward extension of the genesis region; and • Mann and Emanuel (2006) have shown that the AMM is potentially increasing because of Greenhouse Warming; • We have identified other physical processes to support this regional aspect of the trend (to be reported later); • But let us look a bit more closely at the data…. Holland and Webster AMS 0107
Northwest Northeast Southeast Southwest Can Landfalling Storms be used to infer Missing Oceanic Data? The high proportion of landfalling storms in the pre-satellite era has been used to imply poor observations of cyclones in the eastern Atlantic (e.g. Solow and Moore, 2002, Landsea 2006). Holland and Webster AMS 0107
Suggested Correction to pre-1970 Numbers Assuming Landfall Proportion at post 1970 levels The trend is substantially reduced! However Holland and Webster AMS 0107
Non-Landfall Central Landfall East West Comparison of Landfall and non-Landfall Most landfall occurs from equatorial or Gulf of Mexico genesis, but a substantial fraction of these also do not make landfall, as defined by HURDAT. Landfall explains <20% of the post 1970 central and eastern tropical cyclone frequency (defined by the number of 6-h observations) and >75% of the western tropical cyclone frequency. Landfall proportion depends on many factors and is definitely not invariant with time; for example....... Holland and Webster AMS 0107
Implied Correction to pre-1970 Western Frequency Assuming Landfall Proportion at post 1970 levels HURDAT Landfall observations cannot be used to infer basin-wide statistics Implies that storms were over observed by around 20% off the US east coast, in the Gulf of Mexico and in the western Caribbean prior to 1960!!! Holland and Webster AMS 0107
Northwest ?? Northeast ?? Southeast Southwest A more logical consideration Note that there are essentially no “landfalls” on the Windies and that there are a substantial number of cyclones that form in the Caribbean and GOM that do not make landfall. It is reasonable to expect that the bulk of these would have been noticed, even 100 years ago. Thus the random nature of landfall combined with the arbitrary nature of what defines landfall in HURDAT, does not adequately describe the reliable part of the data base. Holland and Webster AMS 0107
Proximity to Observing Regions We assume that all cyclones that cross to the left of the black line were highly likely to have been observed in some form. Note that this says nothing about how accurate the genesis points are or the observed intensity, just whether they were known to have existed. Coast and Major Ship Routes Bermuda Proximity to Land, Islands and Ship Traffic Holland and Webster AMS 0107
All Storms Using the proximity to land and ship route approach implies that almost all storms were within a good observing area for some part of their life. Note the steady increase of non-landfall storms, implying that this has a real component. Note Windies Landfall Holland and Webster AMS 0107
Relationship to HURDAT Landfall The slope is exactly the same for both. Including proximity to land and shipping reduced the scatter and brought the intercept to near zero. Holland and Webster AMS 0107
All Storms 1916-2005, Split at 1960 Maximum Potential Error Prior to 1960 is <~1 storm per year (or around 6% prior to 1960), which agrees with the assessment by Neumann (1999). Additional increase in remote cyclones: Total 23 = 0.5 per year (6% error prior to 1960); Increase in remote eastern development: Total 32 = 0.7 per year (17% error prior to 1960). Holland and Webster AMS 0107
Tropical Storms, Minor and major Hurricanes Min Hurr TS Most of the potential error impact is on tropical storms: ~0.5 per year (10%) prior to 1945; Minor hurricanes: ~0% error; Major hurricanes: <10% per year. Maj Hurr Holland and Webster AMS 0107
Summary • The current Atlantic data base indicates a substantial trend in tropical cyclones and hurricanes and both a multidecadal oscillation and trend in major hurricanes; • The trend is strongly related to Atlantic SST and thus to Greenhouse Warming; • This trend is robust to all known potential problems with the data base, which could change the century trends by a maximum of: • All Tropical Cyclones…150--100% increase; • Minor Hurricanes…100--100% increase; • Major Hurricanes…100--75% increase Holland and Webster AMS 0107