Download
1 / 54
540 likes | 669 Vues
MODIS Land Data Processing – Current Situation and Progress. APEIS Capacity Building Workshop on Integrated Environmental Monitoring of the Asia-Pacific Region Beijing, China September 20, 2002 Mr. Robert Wolfe NASA GSFC Code 922, Raytheon ITSS.

E N D
MODIS Land Data Processing – Current Situation and Progress APEIS Capacity Building Workshop on Integrated Environmental Monitoring of the Asia-Pacific RegionBeijing, China September 20, 2002 Mr. Robert WolfeNASA GSFC Code 922, Raytheon ITSS
Moderate Resolution Imaging Spectroradiometer (MODIS) • Launched December 1999 on NASA EOS Terra Polar Orbiting Satellite • Whisk-broom scanner, 100° Field of View • Orbit: Attitude 705 km, Inclination 98.2°, mean-period 98.9 min., 16-day repeat cycle, 10:30 am equatorial crossing time • Senses entire equator every two days, daily full coverage above 30° latitude • 36 spectral bands: 29 - 1 km, 5 - 500 m and 2 - 250 m nadir spatial resolution • Second MODIS on Aqua Satellite • 1:30 PM equatorial crossing time
Terra Launch: Dec. 18, 1999 First Image: Feb. 24, 2000 Aqua Launch: May 04, 2002 First Image: June 26, 2002
MODIS Terra(1750) MODIS Aqua(2100) July 25, 2002 – Lower Baja Peninsula
Science Team • Formed 11 years ago • 3 Disciplines: Land, Oceans, Atmosphere • Responsibilities: • Algorithm Theoretical Basis Document • Algorithms in Software: PGEs (Product Generation Executables) • QA and Validation • Support Groups • Science Data Support Team (SDST) • Includes: Discipline Support Groups (Coordination) • MODIS Calibration Support Team (MCST) • Includes: MODIS Flight Operations
MODIS Land Science Team Products • Goals : • operationally produce terrestrial remotely sensed products that may be used by expert and non-expert community • establish a 10 year record that has continuity with precursor systems, e.g., AVHRR, and the future NPP and NPOESS VIIRS missions • The MODIS products were developed primarily to serve the global change research community (MODIS has global, near daily coverage) and have many other potential applications • The MODIS Science Team was completively selected to develop peer-reviewed product generation algorithms (24 Principal Investigators, lead: Vince Salomonson)
MODIS True color East Coast Zoom March 3 2000
MODIS Land Products* / ESE Research Themes • Energy Balance Product Suite • Surface Reflectance • Land Surface Temperature • BRDF/Albedo • Snow Cover • Vegetation Parameters Suite • Vegetation Indices • LAI/FPAR • NPP/PSN • Land Cover/Land Use Suite • Land Cover/Vegetation Dynamics • Vegetation Continuous Fields • Vegetation Cover Change • Fire and Burned Area Global Water Cycle and Energy Balance Biology and Biogeochemistry of Ecosystems and the Global Carbon Cycle Land Cover and Land Use Change Atmospheric Chemistry and Aerosols *Dependencies between products
Product Characteristics • HDF-EOS Format • Average file size is about 70 MB
Calibration Summary Terra MODIS • Terra MODIS has been stable for over 22 months • The multiple OBCs have proven to be valuable for on-orbit characterization • Changes in system level response are well understood and have been incorporated into the L1B software • One subsystem (power supply) has failed and a second (formatter) is marginal (was just replaced) • There are no indications of additional problems • Current Geolocation is very accurate (~50 m) Aqua MODIS • Aqua MODIS’ ground tests indicate performance better than Terra MODIS • Initial on-orbit data indicates only minor changes from the pre-launch test results Barnes/MCST
Hi cloud Mid cloud Low cloud Snow Clear MODIS identifies cloud classes Menzel/MODIS Atmosp.
Surface Reflectance/Atmospheric Correction Products • Reflectance corrected for gaseous and aerosol scattering and absorption, surface adjacency effects caused by variations in land cover and atmospheric/surface coupling effect • Building block for generation of a number of land products: VI, BRDF/Albedo and LAI/FPAR
Southern Africa surface reflectance - not corrected for aerosols MODLAND/Vermote
Southern Africa corrected for aerosol MODLAND/Vermote
8-Day Surface Reflectance Composite (detail) Revised algorithm (Min Blue & shadow filter & min view angle) At-launch algorithm (till Nov. 2000) MODLAND/Vermote
MODIS BRDF/Albedo Product • Provides global measures of albedo, BRDF adjusted surface reflectance and surface anisotropy • Inputs • Gridded Surface Reflectance • Outputs • 16 days at a 1km gridded spatial resolution. • Albedos • Bihemispherical (white-sky) • Directional hemispherical (black-sky) albedos local solar noon • 7 Spectral and 3 Broadband Albedos • Nadir BRDF-adjusted Reflectances (NBAR) • 7 Spectral bands at mean overpass solar zenith angle • BRDF kernel weights in 7 spectral bands
No data 0.0 0.1 0.2 0.3 0.4 0.5 Global Broadband White-Sky Albedo (0.3-5.0µm) April 7–22 2001 no data 10 km resolution, Hammer-Aitoff projection, produced by MODIS BRDF/Albedo Team MODLAND/Strahler et al.
No data Global Composite Map of Nadir BRDF-Adjusted Reflectance (NBAR) April 7–22 2001 no data True color, MODIS Bands 2, 4, 3 10 km resolution, Hammer-Aitoff projection, produced by MODIS BRDF/Albedo Team MODLAND/Strahler et al.
Snow and Ice Cover Eight-Day Composite Global Climate Modeling Grid Snow Map (5.6-km resolution, 1/20°) December 18 - 25, 2000 Key parameter of the global energy balance, reflecting much of the incident solar radiation back to space
9.0 million sq. km of snow cover 10.8 million sq. km of snow cover Nov 1-7, 2000 Nov 8-15, 2000 Change in maximum snow extent between two composite periods seen above (1.8 million sq. km) Snow on both Snow on Nov 1-7 only Snow on Nov 8-15 only Clouds MODLAND/Hall et al.
Land Surface Temperature (LST) and Emissivity • Split-window and statistical regression techniques are used • Good indicator of both the energy balance at the Earth’s surface and the greenhouse effect • Useful for a wide variety of climate, hydrological, ecological, and biogeochemical studies Eight-Day Composite day-time 1km LST (k) Sept. 13 - 20, 2000
8-day LST Day-Night Comparison LST Day LST Night Daytime LST as the red component, and Nighttime LST as the green and blue components (after histogram-equalization enhancement). Pixels with daytime LST values but without nighttime LST values are in red.. Color Composite
Vegetation Indices • Used for global monitoring of vegetation conditions • Normalized Difference Vegetation Index (NDVI) and an improved Enhanced Vegetation Index (EVI) • EVI uses self-correcting atmospheric and soil calibration factors • Play an important role in the derivation of the land cover and land cover change, FPAR, LAI, and thermal products
NDVI vs. EVI NDVI EVI
LAI and FPAR • Leaf Area Index (LAI) and Fractional Photosynthetically Active Radiation (FPAR) • LAI defines an important structural property of a plant canopy which is the one-sided leaf area per unit ground area • FPAR measures the proportion of available radiation in the photosynthetically active wavelengths (400 to 700 nm) that a canopy absorbs LAI March-25-2000
MODIS LAI MODIS FPAR MODLAND/Myneni et al.
MODIS Global 1-km Land Cover • Inputs • Primary: • View-angle corrected (nadir) surfacereflectance (NBAR), 7 land bands • Ancillary: • Spatial Texture from 250-m; enhanced vegetation index; snow cover; land surface temperature; directional information • Outputs • IGBP 17 classes, UMd 14-classes; BGC 6 Biomes • Classification Confidences • Approach • Supervised approach, Artificial neural networks, Decision trees, GAM Statistical Boosting • Global Test Sites for Training and Testing • System for Terrestrial Ecosystem Parameterization ( 920 sites ) – site labeling test sites for training Beta Product Release date – April 27, 2001; Provisional Product June 1, 2001 MODLAND/Strahler et al
Vegetative Cover Conversion and Continuous Fields Vegetative Cover Conversion • Detects and labels changes in land cover • Uses the 250m Surface Reflectance products Vegetation Continuous Fields • Percent cover for basic land cover types • Post-launch product Vegetation Continuous Fields
IGBP Land Cover Units (17) • Natural Vegetation (11) Evergreen Needleleaf Forests Evergreen Broadleaf Forests Deciduous Needleleaf Forests Deciduous Broadleaf Forests Mixed Forests • Closed Shrublands • Open Shrublands Woody Savannas Savannas Grasslands Permanent Wetlands Based on Life-Form, Height, and Cover Fraction • Developed and Mosaic Lands (3) Urban and Built-Up Lands Croplands Cropland/Natural Vegetation Mosaics • Nonvegetated Lands (3) Snow and Ice Barren Water Bodies
Fire and Thermal Anomalies • Fire is an important ecosystem process and source of trace gas emissions. • Identifies the location, timing and energy of fires • Near-real time alerts of volcano and fire activity (experimental product) • Burned area estimation and for use with global models (post-launch product) MODIS Fires, NW Australia, Oct 2, 2000
Idaho/Montana September 5, 2000 x MODIS burned area composite NFDR Fuel model x EF and CF from Ward and Hardy (1991) % Area burned in this scene relative to the total in the U.S. in 2000 MODIS Fire Emissions
MODIS Burned Area Product Evaluation Left burned area algorithm results -> burning over days 249-290 (500m) Right temporal composite of MODIS day and night active fires detected over same period (1km) Key purple - beginning of the time series (day 249) red - end of time series (day 290) white - insufficient data in the time series to make a burning decision MODLAND/Roy
MODIS Production and Distribution • MODIS production commenced Feb. 2000 • Collection 1: Beta • L1: 2/00 to 5/01 • L2+ 2/00 to 3/01 • Collection 3: “Provisional” • L1: 2/00 to 9/02 (from 11/00 onward validated) • L2+: 11/00 to 9/02 • Collection 4: “Validated” • Ocean from 6/02 to 10/02 at 6 to 8X • Starting 11/02 for L1 and L2+ Land and Atmosphere at 3 to 4X • Reprocessing – 2/00 to 10/02 • Extend time series back in time (preliminary): A) 11/01 to 10/02; B) 11/00 to 10/01; C) 2/00 to 10/00
Science Code Delivery • Alpha/Beta (2-3 years before launch) • simulated data (MAS data) • data system test, sizing • interface testing • Version 1 (1 year before launch) • Version 2 (at launch) • Beta product quality • Version 3 (first reprocessing) • Provisional product quality • etc. (validated)
Processing Driven by Production Rules • Required and optional inputs • Upstream products, ancillary data • How long to wait • Processing Period • 5 min., 1, 8, 16, 32 or 96 days, calendar months, calendar years) • Start of period (reset at beginning of year, 2-3 day overlap at end of year) • On-line and near-line retention time
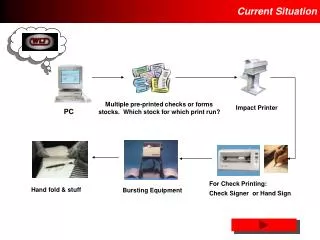
MODAPS Design • Loader • Determines when products can be generated (generates individual tasks) • Scheduler • Schedules all tasks • Allocates system resources, monitors task • Stage inputs, output product disposition • Archiver • Moves data from disk to tape and back • Importer/Exporter • Ingests L1 and Ancillary Data from DAAC • Distributes L2+ data to DAACs and users • GUIs (Graphical User Interfaces) • X-windows (Operator) and Web based (Operators and other users)
MODAPS Hardware • 80 Processors – 10 ECS Gflops • 6.3 Gflops available in ops. (excluding overhead) • Compare to 4.2 Gflops load in ‘96 baseline • Most processes’ load lower than baseline • 44 TB disk – 800 MB/s aggregate access • 100 TB tape – 60 MB/s aggregate access • Theoretical rate: 5.1 TB/day • Actual for 8/16-day retrieves: 0.5 to 0.75 TB/day • Space for about 100 days of data
Design Issues • Number of files vs. product size • Disk vs. Tape • Production rule complexity • System reliability • Interfaces (leaky pipes) • Product Format • Map projection, Tiling – for global products • Usability – heritage vs. improvements • HDF-EOS, Metadata • Network • Long term archive
MODLAND Grids • Fine resolution grids for the L2G, 3 and 4 products are based on two map projections: • Integerized Sinusoidal (ISIN) => Sinusoidal (SIN) Grid • Lambert Azimuthal Equal-Area (LAEA) (polar grids) • Almost all of the fine resolution products will be made in the ISIN/SIN • Exception: Sea-ice products are made in the in the LAEA projection with the grid centered at the north and south poles (EASI Grid implementation) • Grid cell size varies by product and is either (approx.) 0.25 km, 0.5 km or 1 km – actual size depends on the projection • Each grid is broken into non-overlapping tiles which cover approx. 10 x 10 deg. area • Coarse resolution global Climate Modeling Grid (CMG) products are made in a geographic projection with grid cell sizes of 0.25 or 0.5 deg.
MODIS Land Validation • Uses a hierarchical measurement concept • focused on EOS Land Validation Core Sites • combining satellite and airborne data with ground based in-situ measurements • augmented by established field sites and measurement networks, e.g., LTERS, FLUXNET, AERONET • Interacting with other Terra, NASA Earth Science Enterprise, and international instrument teams (GLI, ATSR, MERIS) • Participates in community intensive field campaigns (LBA – South America, SAFARI 2000 – southern Africa) • Collaborating with the data providers to make validation data openly available
Multiple Observations – Simple Case Distribution of coverage for each of the observation with the largest intersection with a cell. The observations and grid cell are the same size and have the same orientation. • Multiple observations covering a single grid cell: • about 50% of overlap distributed into two observations, and • 25% of overlap distributed over four observations.