Download
1 / 48
640 likes | 2.03k Vues
IE 337: Materials & Manufacturing Processes. Lectures 7&8: Introduction to Metal Casting. Chapters 10 & 6. Assignment. HW 2 due today CH 21,22 and 24 Problems In Assignments folder. This Time. Basic Process Casting Terminology Heating Pouring Phase diagrams Solidification. Casting.

E N D
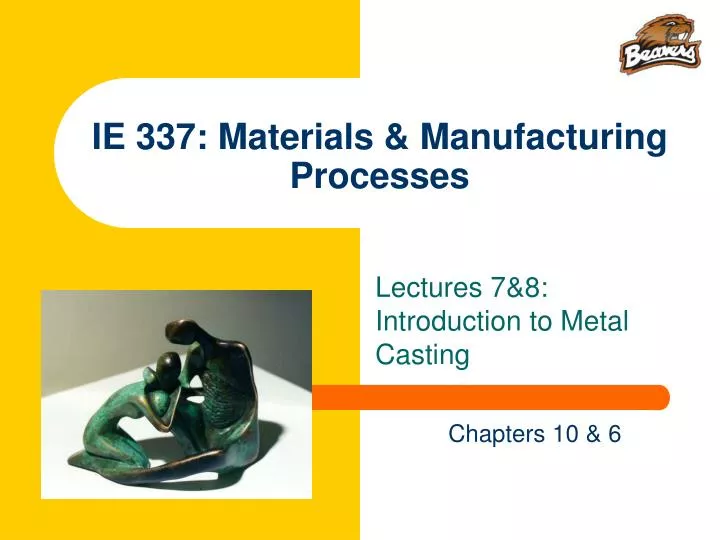
IE 337: Materials & Manufacturing Processes Lectures 7&8: Introduction to Metal Casting Chapters 10 & 6
Assignment • HW 2 due today • CH 21,22 and 24 Problems • In Assignments folder
This Time • Basic Process • Casting Terminology • Heating • Pouring • Phase diagrams • Solidification
Casting Common process attributes: • Flow of Molten Liquid Requires Heating • Heat Transfer of Liquid in Mold Cavity During and After Pouring • Solidification into Component
Metal Casting Processes Categories • Expendable mold processes - mold is sacrificed to remove part • Advantage: more complex shapes possible • Disadvantage: production rates often limited by time to make mold rather than casting itself • Permanent mold processes - mold is made of metal and can be used to make many castings • Advantage: higher production rates • Disadvantage: geometries limited by need to open mold
Overview of Sand Casting • Most widely used casting process, accounting for a significant majority of total tonnage cast • Nearly all alloys can be sand cast, including metals with high melting temperatures, such as steel, nickel, and titanium • Parts ranging in size from small to very large • Production quantities from one to millions
Sand Casting Sand casting mold
Gating System Channel through which molten metal flows into cavity from outside of mold • Consists of a downsprue, through which metal enters a runner leading to the main cavity • At top of downsprue, a pouring cup is often used to minimize splash and turbulence as the metal flows into downsprue
Riser Reservoir in the mold which is a source of liquid metal to compensate for shrinkage during solidification • The riser must be designed to freeze after the main casting in order to satisfy its function
Heating the Metal • Heating furnaces are used to heat the metal to molten temperature sufficient for casting • The heat required is the sum of: • Heat to raise temperature to melting point • Heat of fusion to convert from solid to liquid • Heat to raise molten metal to desired temperature for pouring
Heating the Metal • Heat to melting point: rVCs(Tm-To) • Heat of fusion to convert from solid to liquid: rVHf • Heat molten metal to pouring temp.: rVCl(Tp-Tm) r = density, V = volume, Cs = specific heat, Hf = latent heat of fusion, T= temperature • Properties vary with temperature and phase • Melting may occur over a temperature range • Heat loss to the ambient
Pouring the Molten Metal • For this step to be successful, metal must flow into all regions of the mold, most importantly the main cavity, before solidifying • Factors that determine success: • Pouring temperature • Pouring rate • Turbulence
Pouring Calculations 1 Minimum mold filling time, MFT MFT =V/Q Q: volumetric flow rate, cm3/s V: mold cavity volume, cm3
Pouring Calculations 2 Volumetric flow rate remains constant Q =v1A1 = v2A2 Q: volume rate of flow cm3/s v: velocity of the liquid metal A: cross-sectional area, cm2 CONTINUITY EQUATION Increase in area results in decrease in velocity
Pouring Calculations 3 Flow of liquid metal through gating system & mold v = (2gh)1/2 v: velocity of the liquid metal at base of sprue g = gravitational acceleration, 981 cm/s2 h = height of sprue, cm
Example 1 • The downsprue leading into the runner of a certain mold has a length = 175 mm. • The cross-sectional area at the base of the sprue is 400 mm2. • The mold cavity has a volume = 0.001 m3. • Determine: (a) the velocity of the molten metal flowing through the base of the downsprue, (b) the volumetric flow rate, and (c) the time required to fill the mold cavity.
Example 1: Solution • (a) Velocity v = (2gh)0.5 = (2 x 9810 x 175)0.5 = 1853 mm/s • (b) Volume flow rate Q = vA = 1853 x 400 = 741,200 mm3/s • (c) Time to fill cavity MFT = V/Q
Solidification of Pure Metals A pure metal solidifies at a constant temperature equal to its freezing point (same as melting point)
Solidification and Cooling Figure 10.8 Shrinkage of a cylindrical casting during solidification and cooling: (0) starting level of molten metal immediately after pouring; (1) reduction in level caused by liquid contraction during cooling (dimensional reductions are exaggerated for clarity).
Microstructure: I Characteristic grain structure in a casting of a pure metal, showing randomly oriented grains of small size near the mold wall, and large columnar grains oriented toward the center of the casting
Solidification of Alloys Most alloys freeze over a temperature range rather than at a single temperature
Microstructure: II Characteristic grain structure in an alloy casting, showing segregation of alloying components in center of casting Micro-segregation
Microstructure: II Characteristic grain structure in an alloy casting, showing segregation of alloying components in center of casting Macro-segregation
Phase Diagrams A graphical means of representing the phases of a metal alloy system as a function of composition and temperature • A phase diagram for an alloy system consisting of two elements at atmospheric pressure is called a binary phase diagram • Other forms of phase diagrams are discussed in texts on metallurgy and materials science
Phase Diagrams • Composition is plotted on the horizontal axis and temperature on the vertical axis • Any point in the diagram indicates the overall composition and the phase or phases present at the given temperature under equilibrium conditions
Copper-Nickel Phase Diagram Figure 6.2 Phase diagram for the copper‑nickel alloy system.
Copper‑Nickel (Cu-Ni) Alloy System • Solid solution alloy throughout entire range of compositions below the solidus • No intermediate solid phases in this alloy system • However, there is a mixture of phases (solid + liquid) in the region bounded by the solidus and liquidus
Chemical Compositions of Phases • The overall composition of the alloy is given by its position along the horizontal axis • However, the compositions of liquid and solid phases are not the same • These compositions can be found by drawing a horizontal line at the temperature of interest • Where the line intersects the solidus and liquidus indicates the compositions of solid and liquid phases, respectively
Example Determine compositions of liquid and solid phases in the Cu-Ni system at an aggregate composition of 50% nickel and a temperature of 1316oC (2400oF)
Inverse Lever Rule – Step 1 • The phase diagram can be used to determine the amounts of each phase present at a given temperature • Using the horizontal line that indicates overall composition at a given temperature, measure the distances between the aggregate composition and the intersection points with the liquidus and solidus, identifying the distances as CL and CS, respectively
Inverse Lever Rule – Step 2 • The proportion of liquid phase present is given by L phase proportion = • And the proportion of solid phase present is given by S phase proportion =
Applications of the Inverse Lever Rule • Methods for determining chemical composition of phases and amounts of each phase are applicable to the solid region of the phase diagram as well as the liquidus‑solidus region • Wherever there are regions in which two phases are present, these methods can be utilized • When only one phase is present, the composition of the phase is its aggregate composition under equilibrium conditions, and the inverse lever rule does not apply
Tin-Lead Phase Diagram Figure 6.3 Phase diagram for the tin‑lead alloy system.
Effect of Solidification Rate Mechanical properties of 2 identical composition samples with different cooling rates
Solidification Time • Solidification takes time • Total solidification time TST = time required for casting to solidify after pouring • TST depends on size and shape of casting by relationship known as Chvorinov's Rule
Chvorinov's Rule where TST = total solidification time; V = volume of the casting; A = surface area of casting; n = exponent usually taken to have a value = 2; and Cm is moldconstant
Mold Constant in Chvorinov's Rule • Cm depends on mold material, thermal properties of casting metal, and pouring temperature relative to melting point • Value of Cm for a given casting operation can be based on experimental data from previous operations carried out using same mold material, metal, and pouring temperature, even though the shape of the part may be quite different
Example 1 • In casting experiments performed using a titanium alloy and a zircon sand mold, it took 155 s for a cube-shaped casting to solidify. The cube was 50 mm on a side. • If the same alloy and mold type were used, find the total solidification time for a cylindrical casting in which the diameter = 30 mm and length = 50 mm.
Example 1: Solution • Cylinder Volume V = pD2L/4 = p(30)2(50)/4 = 35,343mm3 • Cylinder Area A = 2pD2/4 + pDL = p(30)2/2 + p(30)(50) = 6126 mm2 • Cylinder (V/A) = 35,343/6126 = 5.77 mm • TST = Cm(V/A)2 = 2.23 (5.77)2 =74.3 s • Cube Volume V = (50)3 = 125,000 mm3 • Cube Area A = 6 x (50)2 = 15,000 mm2 • Cube (V/A) = 125,000/15,000 = 8.33 mm • Cm = TST/(V/A)2 = 155/(8.33)2 = 2.23 s/mm2
What Chvorinov's Rule Tells Us • A casting with a higher volume‑to‑surface area ratio cools and solidifies more slowly than one with a lower ratio • Since riser and casting mold constants will be equal, design the riser to have a larger volume‑to‑area ratio so that the main casting solidifies first
Shrinkage in Solidification and Cooling Figure 10.8 Shrinkage of a cylindrical casting during solidification and cooling: (0) starting level of molten metal immediately after pouring; (1) reduction in level caused by liquid contraction during cooling (dimensional reductions are exaggerated for clarity).
Shrinkage in Solidification and Cooling Figure 10.8 (2) reduction in height and formation of shrinkage cavity caused by solidification shrinkage; (3) further reduction in height and diameter due to thermal contraction during cooling of solid metal (dimensional reductions are exaggerated for clarity).
Solidification Shrinkage • Occurs in nearly all metals because the solid phase has a higher density than the liquid phase • Thus, solidification causes a reduction in volume per unit weight of metal • Exception: cast iron with high C content • Graphitization during final stages of freezing causes expansion that counteracts volumetric decrease associated with phase change
Shrinkage Allowance • Patternmakers account for solidification shrinkage and thermal contraction by making mold cavity oversized (See Table 10.1) • Amount by which mold is made larger relative to final casting size is called pattern shrinkage allowance
Example 2 • A mold cavity has the shape of a cube, 100 mm on a side. Determine the volume and dimensions of the final cube after cooling to room temperature if the cast metal is copper. • Assume that the mold is full at the start of solidification and that shrinkage occurs uniformly in all directions. • For copper, solidification shrinkage is 4.9%,solid contraction during cooling is 7.5%.
Example 2: Solution • Volume of cavity V = (100)3 = 106 mm3 • Volume of casting V = 106(1-0.049)(1-0.075) = 879,675 mm3 • Dimension on each side of cube = (879,675)0.333 = 95.82 mm
You should have learned • Basic Process • Sand Casting Terminology • Heating • Pouring • Phase diagrams • Solidification
Next Class • Casting Continued • Chapter 11