Download
1 / 13
130 likes | 233 Vues
INTERIM RESULTS HIGHLIGHTS FOR THE SIX MONTHS ENDED JUNE 30, 2004. Group Financial Highlights For the Six Months Ended June 30. Selected Financial Highlights & Ratios For the Six Months Ended June 30. * As at December 31, 2003. Divisional Highlights For the Six Months Ended June 30.

E N D
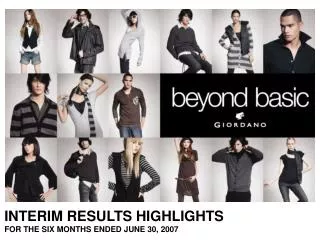
INTERIM RESULTS HIGHLIGHTS FOR THE SIX MONTHS ENDED JUNE 30, 2004
Group Financial Highlights For the Six Months Ended June 30
Selected Financial Highlights & RatiosFor the Six Months Ended June 30 * As at December 31, 2003
Divisional HighlightsFor the Six Months Ended June 30 * Includes interest income and intra-division eliminations
Retail and Distribution Division For the Six Months Ended June 30, 2004 Singapore 11% (11%) Taiwan 20% (19%) Malaysia 4% (4%) Hong Kong 22% (22%) Others 14% (15%) Mainland China 24% (25%) Australia 5% (4%) Note: 1H03’s figures in brackets Retail and Distribution Turnover Composition by Market
Retail and Distribution Division(Cont’d) For the Six Months Ended June 30, 2004 Bluestar Exchange 9% (7%) Giordano Ladies 4% (4%) Giordano core line + Junior 87% (89%) Note: 1H03’s figures in brackets Retail and Distribution Turnover Composition by Brand
Retail and Distribution Division(Cont’d) Brand Statistics • Total comparable store sales 15.3% • Total comparable store gross profit 20.5%
Retail and Distribution Division Market Review All markets’ turnover grew by double-digit YOY due to low comparison bases resulted from SARS in 2003. *Other market’s comp. store sales growth
Retail and Distribution Division Market Review(cont’d) 70 10 30
Number of Outlets, by Region and by Brand (as at June 30, 2004)
Manufacturing Division For the Six Months Ended June 30 • Sales to Group companies accounted for 71% of divisional sales, down from 75% in 1H03 • Secured new clients from US and Europe, reducing reliance on Japanese market
Outlook • All major markets recovered from SARS • Consolidated sales and gross profits rose 5.6% and 11.5%, respectively, compared against 1H02 • Optimistic with outlook • Improvement trend in Taiwan; focus on recapturing market share • Performance is picking up in Korea; major turn- around in 2005 • Higher CAPEX to fund store refurbishment in the 2H • Impress customers with high quality products instead of discount offering