Download
1 / 51
510 likes | 725 Vues
Interim Results for the Six Months ended 31 December 2009. STATEMENT OF COMPREHENSIVE INCOME RE-ANALYSED. 6 Months Ended 31 Dec 2009 R’m. 6 Months Ended 31 Dec 2008 R’m. % Change. Revenue from continuing operations 4 576 4 142 10% Cost of Sales (2 441) (2 232)

E N D
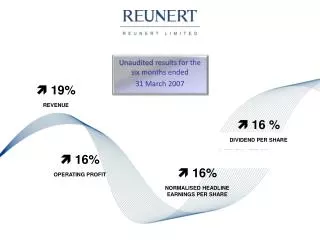
Interim Results for the Six Months ended 31 December 2009
STATEMENT OF COMPREHENSIVE INCOME RE-ANALYSED 6 Months Ended 31 Dec 2009 R’m 6 Months Ended 31 Dec 2008 R’m % Change Revenue from continuing operations 4 576 4 142 10% Cost of Sales (2 441) (2 232) Gross Profit 2 135 1 910 12% Net operating expenses (925) (730) Other operating income 151 4 EBITA 1 361 1 184 15% Amortisation (47) (48) Operating profit 1 314 1 136 16% Net funding costs (173) (239) Share of after tax loss of associates (1) (2) Profit before tax 1 140 895 27% Tax (251) (218) Profit after tax from continuing operations 889 677 31% EPS from continuing operations 240.6 cents 188.7 cents 28% HEPS from continuing operations 242.3 cents 190.2 cents 27%
THE GSK TRANSACTIONS • Completed 1 December 2009 • Contribution for one month – in line with guidance • 68.5 million ordinary shares issued at R66.80 per share • Transaction value of R4.6 billion • Goodwill of R300 million • South African transaction: • 100% of revenue disclosed by Aspen • Sub-Saharan Africa collaboration: • Statement of comprehensive income – profit only • Segmental – 100% of revenue disclosed with reconciliation
REVENUE BY MARKET – DOMESTIC BRANDS 6 Months Ended 31 Dec 2009 R’m 6 Months Ended 31 Dec 2008 R’m % Change SOUTH AFRICA 2 550 2 066 23% South Africa - Pharmaceuticals 1 975 1 525 30% South Africa - Consumer 575 541 6% SUB-SAHARAN AFRICA 279 464 -40% INTERNATIONAL 974 917 6% Asia Pacific 522 484 8% Latin America 345 408 -15% Rest of the World 107 25 334% TOTAL 3 803 3 447 10%
REVENUE BY MARKET – GLOBAL BRANDS 6 Months Ended 31 Dec 2009 R’m 6 Months Ended 31 Dec 2008 R’m % Change Asia Pacific 227 159 43% Latin America 154 110 40% EMENA 414 393 5% Rest of the World 29 34 -15% Total 824 696 18%
SEGMENTAL MARGINS *EBITA % has been normalised to exclude compensation for loss of profits received from insurers in respect of Aspen Nutritionals SOUTH AFRICA * 29% 26% South Africa - Pharmaceuticals 32% 29% South Africa - Consumer* 17% 18% SUB-SAHARAN AFRICA 16% 17% INTERNATIONAL 27% 28% GROUP* 28% 26% 6 Months Ended 31 Dec 2009 6 Months Ended 30 June 2009
FUNDING COSTS 6 Months Ended 31 Dec 2009 R’m 6 Months Ended 31 Dec 2008 R’m Interest paid 281 311 Interest received (91) (116) Net interest 190 195 Preference share dividends 14 21 Notional interest on financial instruments 1 (3) Foreign exchange and fair value losses/(gains) (32) 26 Net funding costs 173 239
ABRIDGED BALANCE SHEET 6 Months Ended 31 Dec 2009 R’m Year Ended 30 June 2009 R’m ASSETS Non-current assets 11 564 6 921 Tangible fixed assets 2 952 2 374 Goodwill 688 398 Intangible assets 7 850 4 104 Investment in associates 21 22 Other non-current assets 53 23 Current assets 4 593 3 536 Cash 1 960 2 065 TOTAL ASSETS 18 117 12 522 EQUITY & LIABILITIES Capital & reserves 9 713 4 263 Non-current liabilities 3 821 4 038 Preference shares – liability 390 392 Long term interest bearing debt 3 052 3 434 Other non-current liabilities 379 212 Short term interest bearing debt 2 428 2 670 Other current liabilities 2 155 1 551 TOTAL EQUITY & LIABILITIES 18 117 12 522
ABRIDGED CASH FLOW STATEMENT 6 Months Ended 31 Dec 2009 R’m 6 Months Ended 31 Dec 2008 R’m % Change Cash flows from operating activities Cash operating profit 1 482 1 328 12% Working capital requirements (316) (297) 6% Cash generated from operations 1 166 1 031 13% Net funding costs paid (190) (301) -37% Tax paid (185) (184) 1% Net inflow from operations 791 546 45%
KEY RATIOS 6 Months Ended 31 Dec 2008 Year Ended 30 June 2009 6 Months Ended 31 Dec 2009 *Normalised to eliminate affect of insurance compensation ** Excludes working capital acquired under the GSK transactions Gross margin % 46% 46% 47% EBITA % 29% 27% *28% Gearing 59% 51% 29% Net debt / EBITDA 2.3x 1.9x 1.5x Net interest cover 6x6x 7x Return on shareholders equity (annualised) 38% 38% 38% Working capital as a % of total Group sales (annualised) 24% 27% **28%
DISTRIBUTION OF FUND MANAGERS As at December 2008 As at June 2009 As at December 2009
ASPEN GROUP – THE HEADLINES • Aspen group sales has shown strong volume and value growths: • Global brands and Aspen South Africa overperforming • Latam and sub-Saharan Africa underperforming • Results underpinned by strong cash flows: • Reduced funding costs • Relative Rand hedge element displayed: • Strong Rand relative to basket of currencies • SA ↑ International ↓ • Last year we saw the reverse • GSK transactions to be included for the next six months • The manufacturing investment is proving to be a competitive springboard: • Real reductions in costs achieved • Further reductions anticipated • Key operational regions covered in detail: • Aspen in South Africa, sub-Saharan Africa, Latam and Asia Pacific
ASPEN IN SOUTH AFRICA - INTRODUCTION • Aspen’s legacy stretches back over 150 years in South Africa, linking back to Lennon in 1850 • Through a passionate and committed team, the Group has achieved exceptional growth over the last 12 years: • CAGR of over 40% per annum • Aspen is South Africa’s number 1 pharmaceutical company in both the public and private sectors: • 16.2% of South Africa’s total private market • 33.7% of South Africa’s private generic market • Aspen’s product offering includes more than 2000 SKU’s • Aspen supplies one in four tablets to every public sector institution: • Share to increase • Aspen supplies nearly three in four ARV tablets sold by the South African government • Aspen supplies between one in four / five of every dispensed script by pharmacists in the South African private sector
ASPEN IN SOUTH AFRICA - INTRODUCTION • Aspen is one of the top 20 generic manufacturers worldwide • Aspen is arguably the largest manufacturer in the Southern Hemisphere, manufacturing in excess of 8 billion tablets with the capability of manufacturing, inter alia: • Steriles, lyophilised vials, liquids, semi-solids, oral contraceptives, infant nutritionals, fine chemicals, penems, hormonal vials, amps and FFS, cytotoxics, suppositories and injectables • Aspen is Africa’s largest pharmaceutical manufacturer: • 16 Manufacturing facilities • Across 5 continents • Aspen is the only company on the continent with FDA / WHO accredited facilities both at a FDF and API level • Aspen is a global leader in generic ARVs: • Touch about 1 million lives per month
ASPEN’S PERFORMANCE IN SOUTH AFRICAN MARKET • Aspen has had an outstanding start in this financial year: • Sales ↑ 23% • Operating Profit ↑ over 50% • Pharma business continues its growth trajectory: • Price and volume increases • Favourable exchange rate • GSK business included for one month: • Business seamlessly transitioned • Consumer business has been affected by the economic cycles: • IMF business affected by the fire: • Expect to have manufacture back on line in July • Alternate supply sourced ex Europe • Public sector: • Recent awards confirm cost competitiveness: • Analysed later • Reliability proven during ARV scale up • Results have underlined resilience of Aspen and our competitive advantages within the market
THE MARKET PERFORMANCE Total Private Market as at December 2009 R21.08bn (December 2008 – TPM R18.56bn) OTC R5.80bn Ethical/Branded R11.08 bn Generic R4.20bn
THE MARKET PERFORMANCE South African Private Market Growth as per IMS – December 2009 ASPEN MARKET +18% +14% Total +15% +18% Generic +18% +12% OTC +24% +13% Branded Generics continue to outpace the market
ASPEN IN THE SOUTH AFRICAN MARKET Total Pharma Market MAT Rand Share % as per IMS – December 2009 GSK incorporated
GENERIC PERFORMANCE IN THE SOUTH AFRICA MARKET South African Private Market MAT Rand Share % (Sch 3-7) as per IMS – December 2009 Generics have a 27.5% value share
PERFORMANCE IN THE SOUTH AFRICAN GENERIC MARKET Private Generic Market MAT Rand Share % as per IMS – December 2009 Market share lost in first quarter due to strike – recaptured in second quarter
ASPEN IN THE SOUTH AFRICAN MARKET Total Branded Market MAT Rand Share % as per IMS – December 2009 GSK consolidated retrospectively
ASPEN IN THE SOUTH AFRICAN MARKET Private OTC Market MAT Rand Share % as per IMS – December 2009 Challenging for number 1 spot here
ASPEN’S SOUTH AFRICAN MODEL People Pipeline Products Cost Aspen has a simple model Business is simple – We don’t complicate it!
ASPEN’S STRENGTH OF REPRESENTATION FIELD FORCE SIZE IN SOUTH AFRICA People Field force size affords Aspen a competitive share of voice and comprehensive coverage of all important customer segments
TOP 20 THERAPEUTIC CLASSES – 1ST TEN Products/Pipeline Aspen has a presence in 19 of the top 20 therapeutic categories and in 14 of them we are performing better than the market
TOP 20 THERAPEUTIC CLASSES – 2ND TEN Products/Pipeline Relevance of range displayed by our presence across a breadth of therapeutic classes
ASPEN IN THE SOUTH AFRICAN PRIVATE MARKET Result of having the best people and relevant, quality products Source: ImpactRx Report - this data was collected over the period January 2007 – June 2009 We don’t only detail our products – we make sure they are actually dispensed
GLOBAL COST COMPETITIVENESS – FOCUS ON COST OF GOODS • Realising the benefits of our ambitious build plan • Doubling capacity in OSD 1 • 7% incremental cost • Can double this again • Volume increases (including Global brand manufacture) • Significant cost reductions – consolidation of sites Technical Centre Heritage facility SVP facility OSD 2 SVP Warehouse OSD 1 Packing Electricity is 5% of our conversion cost OSD 1 Manufacture Targeting a 50% reduction in conversion costs over 3 years
FOCUS ON GLOBAL COST COMPETITIVENESS Result of cost reductions – RT289 Solid Tender 2009 2007
PROSPECTS FOR THE NEXT SIX MONTHS • Volume increases to continue • SEP price increase was in February 2009: • SEP increase in April/May 2010? • Relative increase versus last year will not include the same price effect • Incorporation of GSK business: • Will add about R400 million to sales for next six months • Continued conversion efficiencies: • Contribute to improved costs • ARV tender to be awarded in June: • Limited profitability: • Predominantly affects manufacture / jobs • Shifts will have more challenges operationally rather than commercially • Expect a further ramp up in lives to be covered Well positioned to finish what we started
PROSPECTS – ASPEN IN THE SOUTH AFRICAN MARKET For an additional challenge now we have added a new ball for the team We have said historically: “The greatest reward for those of us working within Aspen is the ability to successfully juggle” Our own social contract of commitment to providing quality, affordable healthcare Being at the forefront of combating infectious diseases on the continent Managing to provide superior returns to all our stakeholders
REST OF SUB-SAHARAN AFRICA (SSA) • Current interest in SSA is in following broad categories: • Export from South Africa: • Negatively affected by ARV genericisation: • Commitment to procure API from licensor • Pipeline focus on hormonals, IMF, OTC and other niche products • Have infrastructure / capability to register Aspen-owned IP • Shelys/Beta in East and Central Africa: • Focus on private market paying dividends • Collaboration with GSK: • See attached geographical sales breakdown • Rolling out the regulatory process
SHELYS AFRICA & ASPEN EXPORTS Six Months to December 2009 SHELYS/BETA • Shelys Africa consists of: • Shelys Pharmaceuticals (Tanzania) • Beta Healthcare (Kenya & Uganda) • Shelys Export – (focus on Southern/East Africa) • Sales force is in-house and contract rep teams • Total rep force : 98 + 19 contract ASPEN EXPORTS • Local distributors for sales & distribution • 8 reps and extensive distributor network BETA 41 reps R48m ASPEN EXPORTS 8 reps R63m SHELYS 63 reps R100m SHELYS EXPORT 13 reps R10m
GSK ASPEN HEALTHCARE FOR AFRICA Calendar Year 2009 – Annual Sales • Extensive cover of 4 regions: • FWCA – 15 countries • AWA – 5 countries • EA – 9 countries • StnA – 9 countries • Sales teams mostly in-house • Some regions have additional contract / wholesale teams that work exclusively for the collaboration TOTAL REP FORCE : 260 TOTAL SALES : $117 million FWCA 70 reps $30m AWA 90 reps $48m EA 70 reps $28m StnA 30 reps $11m
ASPEN IN REST OF SUB-SAHARAN AFRICAN (SSA) • These territories are particularly difficult to trade in • Individual territory market sizes are generally too small to warrant individual company representation • Supply chain including distribution and collection are significant barriers to entry • Have market coverage across all of SSA: • Currently hold 736 registrations • 274 products in the registration process • 1 261 registrations planned for submission in 2010 • Deep understanding of each market and its needs: • In-country relationship with regulatory authorities • Over 360 reps and numerous distributors across the continent • Demonstrated manufacturing commitment in Africa • Number 1 together with GSK Aspen Healthcare for Africa in many if not most African markets with nearly $200 million of annualised sales: • Scale is a critical success factor in smaller markets
An investment with Aspen means not only investing South Africa’s number 1 Pharma Company, but South Africa and the rest of Sub Saharan Africa’s number 1
ASPEN IN LATAM Latam Sales by Territory - Six Months December 2009 : R500 million Global brands constitute 31% of sales
ASPEN IN LATAM • Exercised option on balancing 49%: • Awaiting regulatory approval • Strides to pay ± $75 million to Aspen for Campos and other assets: • Facility better fit for Strides’ global strategy • Under recovers within Aspen infrastructure • Strides better positioned to manage commodity markets • Significant restructure of Brazil: • Headcount reduced from over 450 to less than 300 • Net expenses reduced by over R100 million annualised • Advanced stage of negotiation to finalise branded opportunities • Organic pipeline in Brazil is significant: • We expect numerous important registrations within the next 12 months
ASPEN IN LATAM • Further insulin registrations: • Will make a contribution to the second half results • Brazil expected to return to profitability for the next six months: • Result of restructuring • Non-recurrence of current period once-off expenses • Profitability enhanced through: • Pipeline launch • Successful closure of current negotiations • Further transitioning of global products • Regional Global brand sales to double post transition • Now have both hands on the region the business is starting to take the intended shape • Already making a meaningful contribution to revenue: • Now resized to contribute to profitability
ASPEN IN LATAM • Increased representation in Mexico and Venezuela: • Support Global brands • Support own dossiers • Moved a team to be headquartered in Colombia: • Will include Venezuela • Colombia, Chile, Ecuador, Peru and Argentina being assessed Mexico 99 reps Venezuela 27 reps Colombia Ecuador Brazil 123 reps Peru Chile Argentina
ASPEN IN ASIA PACIFIC Asia Pacific Sales By Territory • Australia – 72% of sales • Asia will continue to grow: • Aspen Asia fully functional • Head quarters in Hong Kong • Volumes in Japan up by 10% • Outstanding management team • Growth trajectory continues Six Months to December 2009 : R748 million
ASPEN IN ASIA PACIFIC - PROSPECTS • Additional growth from further licensing agreements and pipeline: • Will add to the second half of financial year • Reviewing opportunities in South East Asia: • Intention to establish infrastructure in Philippines • Base to supply ASEAN market • Regulatory harmonisation • Significant contributor to Aspen Group: • This will continue • Global brands for the region to increase • Opportunities within Australia being explored • Investment region for Aspen
SUMMARY AND PROSPECTS • Currency balance demonstrated: • Will continue into the future • Shift balance between South Africa and Global contributions • GSK transactions to be included in next six months: • Contribute to both sales and operating income • Anticipate sales of nearly R900 million in the next six months • Strong cash flows to continue • Manufacturing investment paying dividends: • Volumes ↑ • Costs rationalised • Reduced conversion cost • In South Africa: • Sales growth influenced by SEP increase and timing • Volumes growth to continue • Simple plan – simple focus: • People, relevant products, pipeline and costs • We have done this for years and we are sticking to the formula