Download
1 / 31
310 likes | 421 Vues
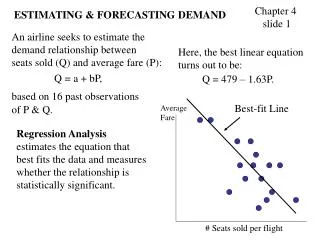
Estimating Credit Demand in Croatia. Katja Gattin-Turkalj, Igor Ljubaj, Ana Martinis, Marko Mrkalj. Overview of the P resentation. Credit developments in Croatia The econometric model Total loans to the private sector Household loans Concluding remarks. Motivation.

E N D
Estimating Credit Demand in Croatia Katja Gattin-Turkalj, Igor Ljubaj, Ana Martinis, Marko Mrkalj
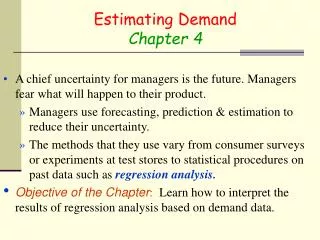
Overview of the Presentation • Credit developments in Croatia • The econometric model • Total loans to the private sector • Household loans • Concluding remarks
Motivation • GDP growth increases demand for loans via income effect and via wealth effect • improving overall economic conditions, growing optimism by consumers and enterprises and sharp decline of interest rates, real convergence… Transition of the financial sector towards the end of 1990’s … predominantly supply side effects demand factors gained greater importance
Three phases of banks’ loan developments and the CNB responses
Increasing role of housing loans highlights the risks associated with house price developments
2. Loans to the private sector - the model
The model– baseline equation -0.06 3.09 -8.75 (-1.29) ***(5.05) ***(-3.52)
GDP coefficient is in line with other studies • Baseline result of GDP elasticity of 3.09 • Calza et al.(2001): 1.34 (eurozone) • Calza et al.(2003): 1.60(eurozone) • Hofmann(2001): between 1.04 and 2.49 (16 industrial countries) • Hülsewig et al. (2001): 1.11 (Germany) • Brzoza-Brzezina (2005): between 1.45 and 3.39 (six European countries)
IR coefficients seem to vary more… • Baseline result of real interest rate elasticity of -8.75 • Calza et al.(2001):-1.01(eurozone) • Calza et al.(2003): -5.05(eurozone) • Hofmann(2001): between -0.01 and -0.08(16 industrial countries) • Hülsewig et al. (2001):-0.69(Germany) • Brzoza-Brzezina (2005): between -4.42 and -10.81(six European countries)
Standard specification tests • Autocorrelation: introducing persistence through lagged dependent variable, improves the fit, although residuals remain "noisy" • Variance inflation factor=1.3 ΔlogYt = β0 + β1Δirt + εi 1/(1 – R2) • Test for omitted variables was done for all variables other than baseline regressors to test the explanatory power of the additional • loanst-1 (Ho: not omitted rejected at 1%), the trend variable z (Ho rejected at 5%), CPI (Ho rejected at 10% significance), and exchange rate (Ho not rejected) • AIC and Schwartz criterion, systematically favor more parsimonious specifications
Recursive coefficients of equation loans =-0.06 + 3.09*gdp+(-8.75)*ir
Results: • the baseline specification seem to satisfactory explain the observed developments of credit; • the extension of the baseline equation, did not significantly change the results • credit growth during the lending boom of the late 1990's and in 2006 remains above the fitted line in all specifications and during the recession that followed the first lending boom credit plunged well below the fitted line; • inclusion of the lagged dependent variable "smoothes" the curve and improves the fit, but even then actual growth remains slightly above the fitted line until 1998Q1 andin 2006.
Results:Loans (yearly growth rates) - baseline specification
3. Household loans - the model
Correlation between household loans andexplanatory variables
Wages seem to move in the opposite direction from loans… Wage and households loans gaps (normalized)
…as well as house price index- possibly due to low data frequency YoY growth rates of house prices and household loans(normalized)
Concluding remarks • the behavior of loans can be explained mainly by the developments of real GDP and real interest rates • GDP captures most important forces behind the loan demand • somewhat unexpectedly, house price index did not contribute to explaining household credit demand