Download
1 / 15
150 likes | 285 Vues
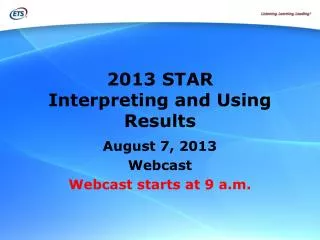
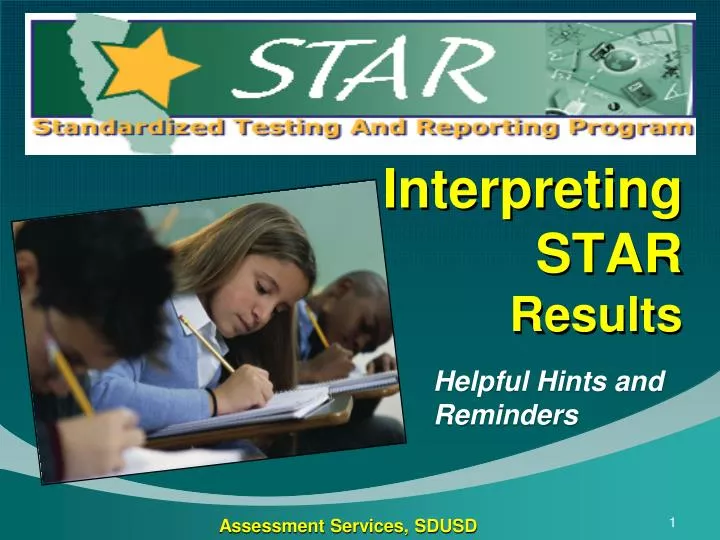
Interpreting STAR Results. Helpful Hints and Reminders. Assessment Services, SDUSD. Contents. Purpose. Scale Scores. Reporting Clusters. Making Comparisons. Student Reports. STAR Results: Purpose.

E N D
InterpretingSTAR Results Helpful Hints and Reminders Assessment Services, SDUSD
Contents Purpose Scale Scores Reporting Clusters Making Comparisons Student Reports
STAR Results: Purpose • STAR results report the progress of students toward proficiency on the state’s academic content standards • They notify where improvement is needed • To help students’ achievement • To improve educational programs • They provide data for state and federal accountability programs
STAR Results: Scale Scores • Scale Scores allow the same score to mean the same thing across test versions within grade and content area • They account for differences in difficulty • Subjects by grade are independently scaled
STAR Results: Reporting Clusters • There are three to six clusters for each subject • Reporting clusters may be useful as indicators of individual or group strengths and weaknesses, but . . . reporting clusters should be interpreted with caution
STAR Results: Reporting ClusterCautions • Reporting clusters are based on small numbers of items; therefore, may not be reliable or generalized • Reporting clusters are not comparable • Different difficulty • Varying number of items • They are NOT equated from year to year
STAR Results: Interpreting Reporting Clusters in the Same Year • While reviewing the reporting clusters for a student, it’s important to compare the % correct for that student to the % correct range of proficient students statewide Back of Student Report
STAR Results: Interpreting Reporting Clusters in the Same Year • While reviewing the reporting clusters for a school, it’s important to compare the % correct for the school to the average % correct statewide
CST Year-to-Year Comparisons Do Compare Same Grade and Same Content Area • Mean scale score- same content and grade, varying years • Percent in each performance level- same content by grade across years (e.g. 2010 ELA grade 10 with 2011 ELA grade 10) Do Compare Percent Proficient and Advanced • Percentage of students scoring at PROFICIENT and above • For a given grade and subject (e.g. percent proficient and above for grade 3 math in 2010 and 2011) • For a given subject and aggregated grades (e.g. percent proficient and above for grades 2– 6 mathematics in 2010 and 2011) • Across grades and a subject (e.g. percent proficient and above in all courses and all grades)
Year-to-Year ComparisonsDON’T Compare: • Individual scale scores for different grades or content areas • Subjects by grade are independently scaled • Different content standards are measured in different grades • Cohorts across grades • Across tests • CMA grades 9−11, STS grades 8−11 to previous years • CAPA, CMA grades 3−5, STS grades 2−4 to years before 2009
STAR Results: Student Report CST Grade 11 Example
STAR Results: Student Report CST Grade 11 Example
STAR Results: Student Report Student nameon back CST Grade 10 Example ♦ = Percent correct obtained by the student on the reporting cluster/content area ▬ = Range of percent correct scores on the reporting cluster for students statewide who scored proficient on that test
STAR Results: Student Report CST Grade 11 Example, EAP Results
For more information see: • http://www.cde.ca.gov/ta/tg/sr/ • http://www.star.cde.ca.gov/ • http://www.startest.org/ Or Contact: Erin Gordon (619) 725-5687 egordon@sandi.net