Download

1 / 50
500 likes | 616 Vues
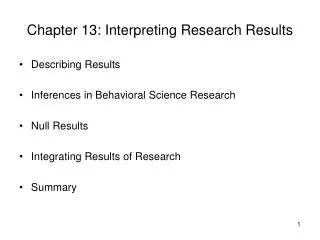
Interpreting Achievement Results. Michael C. McKenna University of Virginia. Today’s Agenda. Discuss types and uses of data Propose some formats for summarizing Reading First data Analyze four student cases Participate in Basic Organizational and Instructional Strategies study group.

E N D
Interpreting Achievement Results Michael C. McKenna University of Virginia
Today’s Agenda • Discuss types and uses of data • Propose some formats for summarizing Reading First data • Analyze four student cases • Participate in Basic Organizational and Instructional Strategies study group
What kind of reading data do we have in Reading First schools?
Criterion-Referenced Tests Compare children against benchmarks Include CRCT and DIBELS Norm-Referenced Tests Compare students against national peers Include PPVT-3 and ITBS
Whew! That’s a lot of information! How can we make sense of it all? Start by thinking about four levels.
Child Classroom Grade School
Let’s start at the school level. The CRCT, ITBS, and DIBELS are all important indicators of schoolwide achievement.
We’ll build a chart that captures these results at a glance.
How can you customize this chart to your own LEA? (10 minutes)
What conclusions can we reach from the CRCT and ITBS? Let’s start with some basics.
CRCT Basics • The USDOE must approve how a state determines AYP. • In Georgia, only the CRCT is approved. • Changes in national policy may be enacted from year to year, so it’s important to stay current. • Only grades 3-5 are considered.
CRCT Basics • Three subgroups are considered: • Race • Special Education • English language learners
CRCT Basics • For a subgroup to count, one of these conditions must be true: 1. If the school has 900 students (K-5), then 10% must be in a subgroup. Or2. If the school has fewer than 900 students, then 75 students must be in a subgroup.
CRCT Basics • A school will be placed on “Needs Improvement” status if it fails to meet AYP two consecutive years in the same academic area. • It does not matter which subgroup fails to achieve the benchmark.
CRCT Basics • Averages for subgroups are not considered by grade level in determining AYP – only averages for grades 3-5 combined. • However, it may be useful to track subgroups across grades, even if there are few in a given subgroup.
AYP Benchmarks Subject 04 05 06 07 08 09 10 11 12 13 14 Rdg/ELA 60 66.7 66.7 66.7 73.3 73.3 73.3 80 86.7 93.3 100 Math 50 58.3 58.3 58.3 66.7 66.7 66.7 75 83.3 91.7 100
AYP Benchmarks Subject 04 05 06 07 08 09 10 11 12 13 14 Rdg/ELA 60 66.7 66.7 66.7 73.3 73.3 73.3 80 86.7 93.3 100 Math 50 58.3 58.3 58.3 66.7 66.7 66.7 75 83.3 91.7 100 Kashinkerry78 80.2 82.4 84.6 86.8 89.0 91.2 93.4 95.6 97.8 100
AYP Benchmarks Subject 04 05 06 07 08 09 10 11 12 13 14 Rdg/ELA 60 66.7 66.7 66.7 73.3 73.3 73.3 80 86.7 93.3 100 Math 50 58.3 58.3 58.3 66.7 66.7 66.7 75 83.3 91.7 100 Kashinkerry78 73 82.4 84.6 86.8 89.0 91.2 93.4 95.6 97.8 100 100 - 73 = 27 27 9 = 3.0
AYP Benchmarks Subject 04 05 06 07 08 09 10 11 12 13 14 Rdg/ELA 60 66.7 66.7 66.7 73.3 73.3 73.3 80 86.7 93.3 100 Math 50 58.3 58.3 58.3 66.7 66.7 66.7 75 83.3 91.7 100 Kashinkerry78 73 76. 79 82 85 88 91 94 97 100
Let’s look at the required subgroups.
African American 30 31 +34 95
Special Education 14 16 +15 45
Special Education 14 16 +15 45
ELL 39 41 +32 112
Hamilton Elementary serves 850 students in grades K-5. Would African Americans need to be considered as a subgroup for determining AYP?
Franklin Elementary serves 970 students in grades K-5. Must English language learners be considered as a subgroup for determining AYP?
Jefferson Elementary serves just 200 students in grades K-5. Must special education students be considered as a subgroup for determining AYP?
CRCT Cautions • Same-Grade Comparisons • Vertical Scaling • Year-to-Year Continuity
An Action Plan for the CRCT 1. Make a table for the past three years. 2. Contrast same-grade with cohort comparisons. 3. Consider disaggregated scores for key subgroups (special education categories, ethnicity, ELL). 4. Compute equal increases through 2014. 5. Communicate these goals to teachers at each grade level, and discuss steps that might help attain them.
How can I keep up to date on AYP? Start by visiting the Georgia DOE web site.
Now let’s look at the ITBS.
Points to Remember • The ITBS is required for all schools at grades 3, 5 and 8 (and RF uses it in 1 and 2). • There is no statewide testing window (but RF is at the end). • The ITBS is not used to determine AYP. • Cohort tracking is not possible unless a school elects to give the ITBS in non-required grades or a third-to-fifth-grade cohort is tracked. • The ITBS permits national comparisons but does not gauge mastery of the Georgia Performance Standards.
Which norms shall we use? Percentile Ranks • Give a fairly precise estimate of standing compared with national age peers. • Cannot be averaged, subtracted, or easily compared.
Percentiles and Football G 50 G Avoid differences in percentile ranks. Use NCEs or stanines instead.
Which norms shall we use? Stanines • Give a gross estimate of standing compared with national age peers. • Cannot be averaged. • Are not well suited to groups.
Interpreting Stanines { 9 8 7 6 5 4 3 2 1 Above Average Stanines 7-9 Borderline Stanine 6 Average Stanine 5 Borderline Stanine 4 Below Average Stanines 1-3 {
Which norms shall we use? Normal Curve Equivalents • Were developed to permit comparisons. • Can be subtracted and averaged. • Are statistically equivalent.
How NCEs are made NCEs “flatten” the normal curve so that differences are statistically equivalent.
Which norms shall we use? Grade Equivalents • Involve shaky estimates. • Compare students of different ages. • Have been condemned by IRA.
Three-Year ITBS Cohort Model A comparison can be made on the basis of those students present at both testings. But this would take time!
Three-Year ITBS Cohort Model Any comparison should focus on normal curve equivalents.
A chart can capture test data at the grade and classroom level. From the chart, you can identify trends, isolate problems, and recognize successes.
Year-Long Second-Grade Classroom-Level Chart Spring CRCT % Pass
A chart of this nature at each grade can help answer important questions . . . • Which classrooms show growth in all areas? • Which classrooms show growth In few areas? • Which areas represent grade-level strengths? • Which areas represent grade-level weaknesses? • How well do DIBELS scores predict CRCT results?
Now let’s turn to the smallest, but most important, unit of data analysis – the child.