Download
1 / 30
300 likes | 392 Vues
P. Navratil, TACC. D. Pugmire, ORNL. WHY THE RULES ARE CHANGING FOR LARGE DATA VISUALIZATION AND ANALYSIS. 11/2/10. Hank Childs Lawrence Berkeley Lab & UC Davis. Supercomputing 101. Why simulation? Simulations are sometimes more cost effective than experiments.

E N D
P. Navratil, TACC D. Pugmire, ORNL WHY THE RULES ARE CHANGING FOR LARGE DATA VISUALIZATION AND ANALYSIS 11/2/10 Hank Childs Lawrence Berkeley Lab & UC Davis
Supercomputing 101 • Why simulation? • Simulations are sometimes more cost effective than experiments. • New model for science has three legs: theory, experiment, and simulation. • What is the “petascale” / “exascale”? • 1 FLOP = 1 FLoating point OPeration per second • 1 GigaFLOP = 1 billion FLOPs, 1 TeraFLOP = 1000 GigaFLOPs • 1 PetaFLOP = 1,000,000 GigaFLOPs, 1 ExaFLOP = billion billion FLOPs • PetaFLOPs + petabytes on disk + petabytes of memory petascale • ExaFLOPs + exabytes on disk + petabytes of memory exascale • Why petascale / exascale? • More compute cycles, more memory, etc, lead for faster and/or more accurate simulations.
Petascale computing is here. • Existing petascale machines Julich JUGene UTK Kraken ORNL Jaguar LANL RoadRunner
Supercomputing is not slowing down. • Two ~20 PetaFLOP machines will be online in 2011 • Q: When does it stop? • A: Exascale is being actively discussed right now • http://www.exascale.org LLNL Sequoia NCSA BlueWaters
Exascale machine: requirements • Timeline: 2018-2021 • Total cost: <$200M • Total power consumption: < 20MW • Accelerators a certainty • FLASH drives to stage data will change I/O patterns (very important for vis!)
How does the petascale/exascale affect visualization? Large scale Large # of variables Large ensembles Large # of time steps
Why is petascale/exascale visualization going to change the rules? • Michael Strayer (U.S. DoE Office of Science): “petascale is not business as usual” • Especially true for visualization and analysis! • Large scale data creates two incredible challenges: scale and complexity • Scale is not “business as usual” • Supercomputing landscape is changing • Solution: we will need “smart” techniques in production environments • More resolution leads to more and more complexity • Will the “business as usual” techniques still suffice? Outline
P2 P4 P1 P3 P0 P5 P8 P7 P6 P9 Production visualization tools use “pure parallelism” to process data. Parallelized visualization data flow network Parallel Simulation Code Read Process Render Processor 0 Read Process Render P0 P1 P2 P3 Processor 1 P4 P5 P6 P7 Read Process Render Pieces of data (on disk) P8 P9 Processor 2
Pure parallelism: pros and cons • Pros: • Easy to implement • Cons: • Requires large amount of primary memory • Requires large I/O capabilities • requires big machines
Tomorrow’s machine Today’s machine Pure parallelism performance is based on # bytes to process and I/O rates. • Amount of data to visualize is typically O(total mem) • Vis is almost always >50% I/O and sometimes 98% I/O • Two big factors: • how much data you have to read • how fast you can read it • Relative I/O (ratio of total memory and I/O) is key Memory I/O FLOPs
Time to write memory to disk Anedoctal evidence: relative I/O is getting slower.
Why is relative I/O getting slower? • “I/O doesn’t pay the bills” • And I/O is becoming a dominant cost in the overall supercomputer procurement. • Simulation codes aren’t as exposed. • And will be less exposed with proposed future architectures.
1TZ 16K, 32K Dawn Franklin Cray XT4 #cores Problem Size Type Machine 8K 0.5TZ AIX 16K 1TZ Purple Ranger BG/P 4TZ 64K Sun Linux Cray XT5 2TZ JaguarPF Juno Linux 1TZ, 2TZ 16K 32K Recent runs of trillion cell data sets provide further evidence that I/O dominates • Weak scaling study: ~62.5M cells/core 2T cells, 32K procs on Jaguar • Approx I/O time: 2-5 minutes • Approx processing time: 10 seconds 2T cells, 32K procs on Franklin 13
Pure parallelism is not well suited for the petascale. • Emerging problem: • Pure parallelism emphasizes I/O and memory • And: pure parallelism is the dominant processing paradigm for production visualization software. • Solution? … there are “smart techniques” that de-emphasize memory and I/O. • Data subsetting • Multi-resolution • Out of core • In situ
P2 P4 P1 P3 P0 P5 P8 P7 P6 P9 Data subsetting eliminates pieces that don’t contribute to the final picture. Parallelized visualization data flow network Parallel Simulation Code Read Process Render Processor 0 Read Process Render P0 P1 P2 P3 Processor 1 P4 P5 P6 P7 Read Process Render Pieces of data (on disk) P8 P9 Processor 2
Data Subsetting: pros and cons • Pros: • Less data to process (less I/O, less memory) • Cons: • Extent of optimization is data dependent • Only applicable to some algorithms
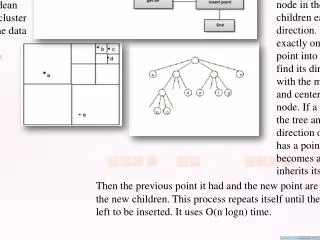
P2 P4 P1 P3 P0 P5 P8 P7 P6 P9 Multi-resolution techniques use coarse representations then refine. Parallelized visualization data flow network Parallel Simulation Code Read Process Render P2 Processor 0 Read Process Render P4 P0 P1 P2 P3 Processor 1 P4 P5 P6 P7 Read Process Render Pieces of data (on disk) P8 P9 Processor 2
Multi-resolution: pros and cons • Pros • Avoid I/O & memory requirements • Cons • Is it meaningful to process simplified version of the data?
P2 P4 P1 P3 P0 P5 P8 P7 P6 P9 Out-of-core iterates pieces of data through the pipeline one at a time. Parallelized visualization data flow network Parallel Simulation Code Read Process Render Processor 0 Read Process Render P0 P1 P2 P3 Processor 1 P4 P5 P6 P7 Read Process Render Pieces of data (on disk) P8 P9 Processor 2
Out-of-core: pros and cons • Pros: • Lower requirement for primary memory • Doesn’t require big machines • Cons: • Still paying large I/O costs • (Slow!)
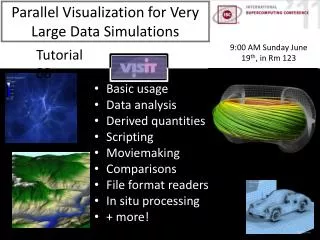
P2 P4 P1 P3 P0 P5 P8 P7 P6 P9 In situ processing does visualization as part of the simulation. Parallel Simulation Code Read Process Render Processor 0 Read Process Render P0 P1 P2 P3 Processor 1 P4 P5 P6 P7 Read Process Render Pieces of data (on disk) P8 P9 Processor 2
P2 P4 P1 P3 P0 P5 P8 P7 P6 P9 In situ processing does visualization as part of the simulation. Parallelized visualization data flow network Parallel Simulation Code GetAccess ToData Process Render Processor 0 GetAccess ToData Process Render Processor 1 GetAccess ToData Process Render Processor 2 … … … … GetAccess ToData Process Render Processor 9
In situ: pros and cons • Pros: • No I/O! • Lots of compute power available • Cons: • Very memory constrained • Many operations not possible • Once the simulation has advanced, you cannot go back and analyze it • User must know what to look a priori • Expensive resource to hold hostage!
Summary of Techniques and Strategies • Pure parallelism can be used for anything, but it takes a lot of resources • Smart techniques can only be used situationally • Strategy #1 (do nothing): • Stick with pure parallelism and live with high machine costs & I/O wait times • Other strategies? • Assumption: • We can’t afford massive dedicated clusters for visualization • We can fall back on the super computer, but only rarely
Now we know the tools … what problem are we trying to solve? • Three primary use cases: • Exploration • Confirmation • Communication Examples: Scientific discovery Debugging Examples: Data analysis Images / movies Comparison Examples: Data analysis Images / movies
Exploration Notional decision process Confirmation No Interactivity required? Do algorithms require all data in memory? No Yes Communication No No In Situ (data analysis & images / movies) Out-of-core (Data analysis & images / movies) Do operations require all the data? Need all data at full resolution? Do you know what you want do a priori? Data subsetting (comparison & data analysis) Multi-resolution (debugging & scientific discovery) No Yes Yes Yes Yes Pure parallelism (Anything & esp. comparison)
Alternate strategy: smart techniques Multi-res Data subsetting In situ Do remaining ~5% on SC Out-of-core All visualization and analysis work
Difficult conversations in the future… • Multi-resolution: • Do you understand what a multi-resolution hierarchy should look like for your data? • Who do you trust to generate it? • Are you comfortable with your I/O routines generating these hierarchies while they write? • How much overhead are you willing to tolerate on your dumps? 33+%? • Willing to accept that your visualizations are not the “real” data?
Difficult conversations in the future… • In situ: • How much memory are you willing to give up for visualization? • Will you be angry if the vis algorithms crash? • Do you know what you want to generate a priori? • Can you re-run simulations if necessary?
How Supercomputing Trends Will Changes the Rules For Vis & Analysis • Future machines will not be well suited for pure parallelism, because of its high I/O and memory costs. • We won’t be able to use pure parallelism alone any more • We will need algorithms to work in multiple processing paradigms