Download
1 / 34
340 likes | 541 Vues
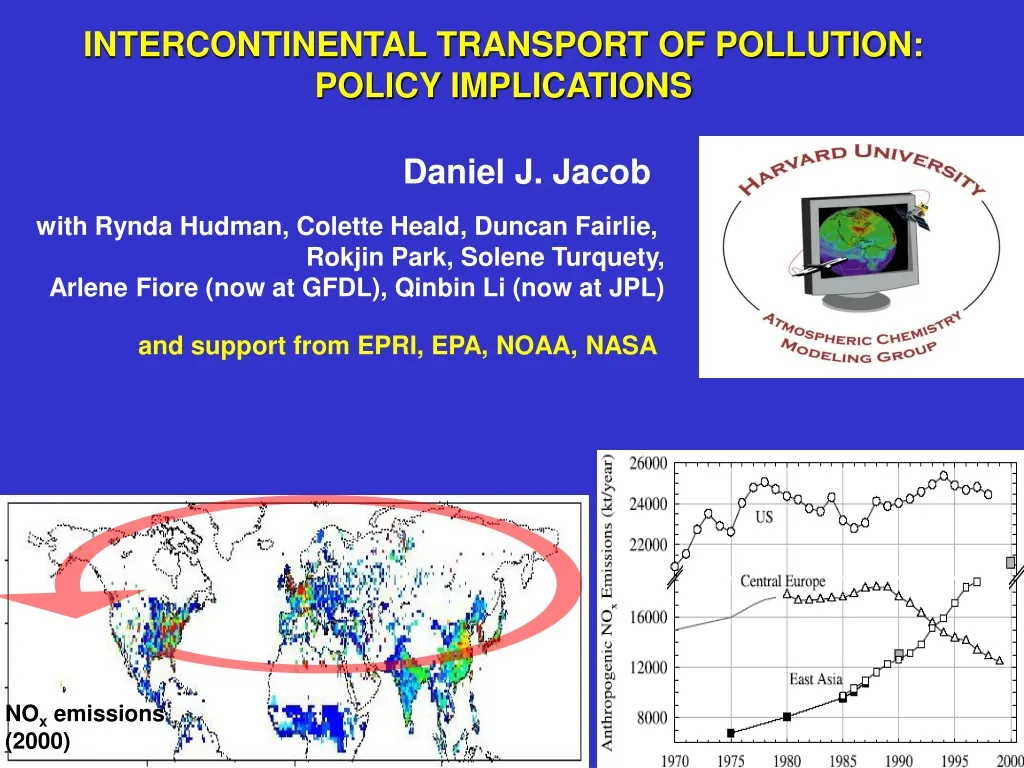
NO x emissions (2000). INTERCONTINENTAL TRANSPORT OF POLLUTION: POLICY IMPLICATIONS. Daniel J. Jacob. with Rynda Hudman, Colette Heald, Duncan Fairlie, Rokjin Park, Solene Turquety, Arlene Fiore (now at GFDL), Qinbin Li (now at JPL). and support from EPRI, EPA, NOAA, NASA. Nitrogen

E N D
NOx emissions (2000) INTERCONTINENTAL TRANSPORT OF POLLUTION:POLICY IMPLICATIONS Daniel J. Jacob with Rynda Hudman, Colette Heald, Duncan Fairlie, Rokjin Park, Solene Turquety, Arlene Fiore (now at GFDL), Qinbin Li (now at JPL) and support from EPRI, EPA, NOAA, NASA
Nitrogen dioxide 124 ppbv (1-hour) Ozone (O3) 84 ppbv (8-hour) Sulfur dioxide (SO2) Particles < 10 mm (PM10) 50 mg m-3 (annual) 15 mg m-3 (annual) • Particles < 2.5 mm (PM2.5) Carbon monoxide (CO) Lead Any pollutant 0 100 50 150 millions OZONE AND PARTICULATE MATTER (PM): TOP TWO AIR POLLUTANTS IN THE U.S. # millions of people living in areas exceeding national ambient air quality standards (NAAQS) [EPA, 2002]
MECHANISMS FOR INTERCONTINENTAL TRANSPORT BETWEEN NORTHERN MIDLATITUDE CONTINENTS • Direct intercontinental transport: fast (~1 week) transport from source to receptor continent; either by boundary layer advection or by lifting to lower free • troposphere followed by subsidence • Hemispheric pollution: pollution mixes in free troposphere, affecting free tropospheric background, in turn affecting surface concentrations by subsidence Tropopause HEMISPHERIC POLLUTION BACKGROUND Mixing Free troposphere 2 km “Direct” intercontinental transport Boundary layer boundary layer advection lifting subsidence Asia N. America Europe
ENVIRONMENTAL IMPACTS OF ATMOSPHERIC OZONE UV shield Greenhouse gas Primary source of OH radicals Smog NOx = NO + NO2: nitrogen oxide radicals VOC (volatile organic compounds) = light hydrocarbons and substituted organic compounds
GLOBAL BUDGET OF TROPOSPHERIC OZONE Tg O3 yr-1present natural O2 hn O3 STRATOSPHERE Mickley et al. [1999] 8-18 km Limiting ozone precursors: Global - NOx and methane Regional – NOx and NMVOCs TROPOSPHERE hn Inventory (Tg): 360 230 NO2 NO O3 hn, H2O OH HO2 O3 H2O2 Ozone lifetime: ~ days in boundary layer ~1 mo in free troposphere Deposition CO, VOC NOx, CO, methane, nonmethane VOC (NMVOC) emissions
stratosphere China coast California coast Longitude Latitude over NW Pacific TROPOSPHERIC OZONE BACKGROUND Airborne lidar observations from TRACE-P aircraft mission over N. Pacific in spring 2001 [Browell et al., 2003] 20-70 ppbv ozone background, increases with altitude and latitude
Europe AQS seasonal 8-h avg Japan AQS 8-h avg. U.S. AQS 8-h avg. U.S. AQS 1-h avg. 0 20 40 60 80 100 120 ppbv present preindustrial Surface background at northern midlatitudes OZONE BACKGROUND IS AN IMPORTANT INCREMENT TOWARD EXCEEDANCE OF AIR QUALITY STANDARDS (AQS)
OZONE BACKGROUND AT NORTHERN MID-LATITUDES HAS A LARGE ANTHROPOGENIC COMPONENT Observations at mountain sites in Europe [Marenco et al., 1994] Preindustrial model ranges Model overestimates of 19th century observations could reflect model errors in natural ozone sources (lightning, stratosphere)…or calibration errors in the data
GEOS-CHEM GLOBAL 3-D MODELOF ATMOSPHERIC TRANSPORT AND CHEMISTRY http://www-as.harvard.edu/chemistry/trop/geos • Developed by Harvard Atmospheric Chemistry Modeling Group, used by 17 research groups in N. America and Europe; ~100 publications. • driven by GEOS assimilated meteorological observations from NASA Global Modeling and Assimilation Office (GMAO); native resolution 1ox1o • applied to simulations of ozone, aerosols (PM), CO2, methane, mercury, hydrogen,… • nested with EPA CMAQ regional model for studies of intercontinental transport Results presented today are from coupled ozone-aerosol simulation with 2ox2.5o resolution, 48 vertical levels
MEAN SURFACE OZONE ENHANCEMENTS FROM ANTHROPOGENIC NOx AND NMVOC EMISSIONS IN DIFFERENT CONTINENTS as determined from sensitivity simulations with these sources shut off GEOS-CHEM model, July 1997 North America Europe 2-6 ppbv mean enhancements over U.S. Asia Li et al. [2002]
over U.S. Subsidence of Asian pollution + local production RANGE OF INTERCONTINENTAL OZONE POLLUTION ENHANCEMENTSAT SURFACE SITES (GEOS-CHEM model) stagnation tropical air effect is maximum for ozone concentrations in mid-range (40-70 ppbv) over Europe Fiore et al. [2002]; Li et al. [2002]
EFFECT OF NORTH AMERICAN SOURCESON EXCEEDANCES OF EUROPEAN AIR QUALITY STANDARD (55 ppbv, 8-h average) GEOS-CHEM model results, summer 1997 Number of exceedance days (out of 92) # of exceedance days that would not have been in absence of N.American emissions Li et al. [2002]
NOAA/ITCT-2K2 AIRCRAFT CAMPAIGN IN APRIL-MAY 2002 Monterey, CA High-ozone Asian pollution plumes observed in lower free troposphere but not at surface (Trinidad Head); strong stratospheric influence (Trinidad Head sondes) Observations by D. Parrish, J. Roberts, T. Ryesrson (NOAA/AL) May 5 plume at 6 km: High CO and PAN, no O3 enhancement CO O3 PAN May 17 subsiding plume at 2.5 km: High CO and O3, PAN gNOxgHNO3 HNO3 Hudman et al. [2004]
Subsidence Over E Pacific OPE 60-80 PAN gNOxgHNO3 PAN NOx HNO3 CONCEPTUAL PICTURE OF OZONE PRODUCTIONIN TRANSPACIFIC ASIAN POLLUTION PLUMES GEOS-CHEM ozone production efficiency (2-4 km) Hudman et al. [2004] Stratospheric downwelling Warm conveyor belt; 5-10% export of NOy mainly as PAN PAN, weak DO3 strong DO3 Asian boundary layer (OPE ~ 5) U.S. boundary layer 10x dilution (Asian dust data) very weak DO3 E. Asia Pacific United States
SURFACE OZONE AT TRINIDAD HEAD, CALIFORNIA DURING ITCT-2K2 May 17 Neither observations nor models show much variability; Asian pollution enhancement (6 ± 2 ppbv in GEOS-CHEM) is significant but undetectable Goldstein et al. [2004]
CALIFORNIA MOUNTAIN SITES ARE PARTICULARLY SENSITIVE TO ASIAN OZONE POLLUTION…because there is less dilution Observed 8-h ozone at Sequoia National Park (1800 m) in May 2002 vs. corresponding simulated (GEOS-CHEM) Asian pollution ozone enhancement May 17 obs. Asian plume event in red Asian enhancements are 6-10 ppbv during NAAQS exceedances; unlike at surface sites, Asian pollution influence is not minimum under high-ozone conditions! Hudman et al. [2004]
IMPORTANCE OF METHANE FOR THE TROPOSPHERIC OZONE BACKGROUND Sensitivity of global tropospheric ozone inventory (Tg) in GEOS-CHEM to 50% global reductions in anthropogenic emissions: NOx and methane have the greatest impacts Anthropogenic methane causes another 4- 6 ppbv enhancement in surface ozone over U.S. Fiore et al., [2002b]
OBSERVATIONS OF INTERCONTINENTAL TRANSPORTDURING ICARTT AIRCRAFT CAMPAIGN (Jul-Aug 2004) Carbon monoxide (CO) columns on July 18 AIRS satellite observations GEOS-CHEM near real time simulation Alaskan fires U.S. pollution Asian pollution Wallace McMillan (UMBC) Solene Turquety (Harvard)
ASIAN POLLUTION PLUME OFF CALIFORNIA sampled by NASA aircraft on July 1, 2004 GEOS forecast Asian CO (9 km) AIRS satellite CO data Asian pollution S. Pawson (NASA), W. McMillan (UMBC), M/ Avery (NASA), S.Turquety (Harvard). L. Jaegle (UW)
ASIAN POLLUTION PLUME OVER EASTERN U.S. GEOS forecast Asian CO (9 km) Observed O3 (ppbv) Observed CO(ppbv) sampled by NASA aircraft on July 15 Observed O3 = 20-40 ppbv, CO = 20 ppbv GEOS-CHEM O3 = 5-10 ppbv, CO = 10-20 ppbv High Halon-1211 in plume confirms Asian origin
0 20 40 60 80 ppbv POLICY-RELEVANT OZONE BACKGROUND (PRB) USED FOR SETTING OF U.S. NAAQS PRB is defined as the ozone concentration that would be present in absence of North American anthropogenic emissions NAAQS (8-h avg.) PRB used for present NAAQS Risk increment Frequent observations at remote U.S. sites attributed by Lefohn et al. [2001] to natural background…and used to argue that NAAQS is unattainable Natural background Present –day background at northern midlatitudes Can natural background indeed be so high as to make current standard unattainable?
Base (2001) Model: * Observations (1-5 pm average) Background (no anthrop. emissions in N. America, present methane) + Natural (no anthrop. emissions globally, preindustrial methane) Stratospheric influence Ozone time series at CASTNet sites used by Lefohn et al. [2001] Occurrences of high values reflect either regional pollution or a high-altitude site At low-elevation sites: background = 20-35 ppbv, natural = 10-25 ppbv Fiore et al. [2003]
* CASTNet sites Model Background Natural Stratospheric Daily mean afternoon O3 at 58 U.S. CASTNet sites + June-July-August Regional Pollution Ozone (ppbv) Cumulative Probability BACKGROUND OZONE IS DEPLETED IN POLLUTION EPISODES Background on polluted days is 20-25 ppbv, below current PRB of 40 ppbv Current NAAQS underestimates health risks and is in fact too high Fiore et al. [2003]
ATMOSPHERIC PARTICULATE MATTER (AEROSOLS) Aerosol: dispersed condensed matter suspended in a gas Size range: 0.001 mm (molecular cluster) to 100 mm (small raindrop) Soil dust Sea salt SO2, NOx, NH3, VOCs • Most important components of the atmospheric aerosol: • Sulfate- nitrate-ammonium • Organic carbon (OC), elemental carbon (EC) • Soil dust • Sea salt
AIRCRAFT OBSERVATIONS IN ASIAN WARM CONVEYOR BELT (WCB) OUTFLOW ILLUSTRATE SCAVENGING OF AEROSOLS DURING LIFTING TO FREE TROPOSPHERE TRACE-P campaign, spring 2001 boundary layer outflow Aerosols scavenged from WCB outflow Ozone: WCB outflow WCB outflow Longitude Data from E.V. Browell
GEOS-CHEM SIMULATION OF TRACE-P OBSERVATIONS P3B DATA over NW Pacific (30 – 45oN, 120 – 140oE) Scavenging from Asian outflow is 80-90% efficient for sulfate and BC, ~100% for nitrate Black carbon (BC) BC underestimated by factor of 2 because emissions [Bond et al.] are too low Park et al. [2004b]
DUST STORMS PROVIDE VISIBLE EVIDENCEOF INTERCONTINENTAL TRANSPORT OF AEROSOLS Clear day April 16, 2001: Asian dust! Glen Canyon, AZ …and anthropogenic pollution is transported together with the dust satellite data satellite data Colette Heald et al. (Harvard)
ASIAN AEROSOL POLLUTION INFLUENCE OVER WESTERN U.S. AERONET aerosol optical depth (AOD) measurements at Missoula, MT Spring 2001 -*- AERONET __GEOS-CHEM __ Asian SO42-+NH4++NO3- __ Asian dust AOD Colette Heald et al. (Harvard)
SO42- NO3- NH4+ mg m-3 MEAN ASIAN POLLUTION INFLUENCES ON SURFACE AEROSOL CONCENTRATIONS Annual means determined from a GEOS-CHEM 2001 sensitivity simulation with Asian anthropogenic sources shut off Enhancements are low relative to air quality standard (15 mg m-3) Park et al. [2004a]
Requires linear improvement in visibility over 2004-2018 at federal class I areas (large national parks) toward a 2064 natural visibility endpoint EPA REGIONAL HAZE RULE deciviews: dv = 10ln(bext/10), where bext is aerosol extinction from EPA [2001] Visibility is a logarithmic function of aerosol extinction a ~50% reduction in anthropogenic emissions required by 2018, sensitive to the definition of the 2064 endpoint
VISIBILITY DEGRADATION STATISTICS IN THE UNITED STATES (2001): MODEL vs. OBSERVATIONS Visibility decrease (deciviews: dv = 10ln(bext/10) ) from sulfate, nitrate, and carbonaceous aerosols Observations (IMPROVE network) GEOS-CHEM R.J. Park (Harvard)
Western U.S. mg m-3 EPA “NATURAL DEFAULT CONCENTRATIONS” FOR THE REGIONAL HAZE RULE ARE TOO LOW …and don’t allow for large enhancement from transboundary pollution Park et al. [2004a]
Desired trend in visibility Phase 1 48% Required % decrease of U.S. anthropogenic emissions 30% IMPLICATIONS FOR EMISSION REDUCTIONS IN PHASE 1 (2004-2018) IMPLEMENTATION OF REGIONAL HAZE RULE Illustrative calculation for mean western U.S. conditions, assuming linear relationship between emissions and PM concentrations, and assuming constant anthropogenic sources from foreign countries between now and 2064 Park et al. [2004]
WHERE ARE ASIAN EMISSIONS HEADED?It’s anyone’s guess Past trends and future projections of Chinese SO2 emissions [Streets et al., 2002]


