Download
1 / 10
130 likes | 385 Vues
We will likely never know these ( population parameters —these are things that we want to know about in the population). The population Number = N Mean = m Standard deviation = s. The Population vs. The Sample. Cannot afford to measure parameters of the whole population. Types of Samples.

E N D
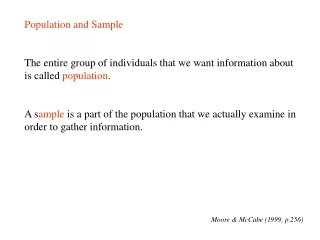
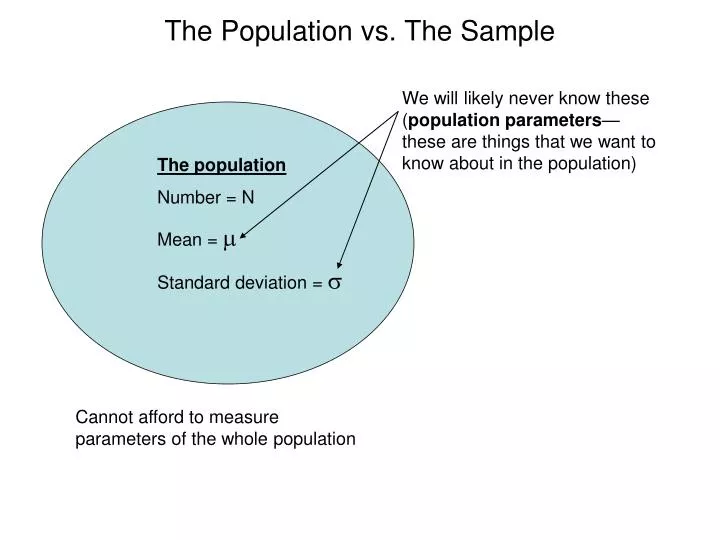
We will likely never know these (population parameters—these are things that we want to know about in the population) The population Number = N Mean = m Standard deviation = s The Population vs. The Sample Cannot afford to measure parameters of the whole population
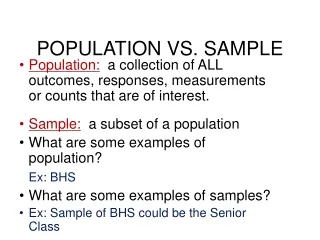
Types of Samples • Haphazard sampling • Convenience or self-selection • Quota sampling • Categories and proportions in the population • Probability sampling • Random sampling • Multistage cluster sampling • accuracy (margin of error) & confidence level
We will likely never know these (population parameters—these are things that we want to know about in the population) The population Number = N Mean = m Standard deviation = s The Population vs. The Sample Cannot afford to measure parameters of the whole population So we draw a random sample.
The Population vs. The Sample The sampleSample size = nSample mean = xSample standard deviation = s Cannot afford to measure parameters of the whole population So we draw a random sample.
Does m= x? Probably not. We need to be confident that x does a good job of representingm. The population Number = N Mean = m Standard deviation = s The Population vs. The Sample The sampleSample size = nSample mean = xSample standard deviation = s
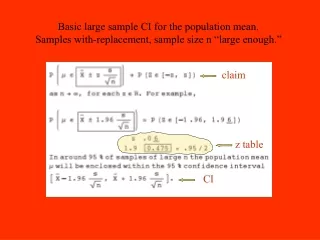
How closely does our sample mean resemble the population mean(a “population parameter” in which we are ultimately interested)? random sampling error Population parameter = sample statistic + (or “standard error”) Connecting the Population Mean to the Sample Mean Random sampling error = (variation component) .or “standard error” (sample size component) Use a square-root function of sample size The sampleSample size = nSample mean = xSample standard deviation = s s = measure of variation Standard error (OR random sampling error) = s .Ö(n-1) Population mean = x + s .Ö (n-1) The population mean likely falls within some range around the sample mean—plus or minus a standard error or so.
To Compute Standard Deviation • Population standard deviation • Sample standard deviation
Why Use Squared Deviations? • Why not just use differences? • Student A’s exam scores/(Stock A’s prices): • 94, 86, 94, 86 • Why not just use absolute values? • Student B’s exam scores/(Stock B’s prices): • 97, 84, 91, 88 • Which one is more spread out /unstable /risky /volatile?
Real-world Data & Visualization • CIA World Factbook rankings • https://www.cia.gov/library/publications/the-world-factbook/rankorder/rankorderguide.html • Gapminder • http://www.gapminder.org/world