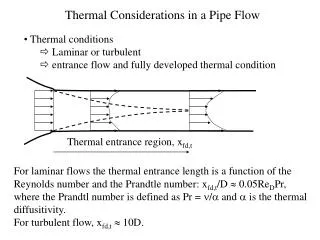
Download
1 / 23
240 likes | 347 Vues
Thermal Effects on Critical Flow Venturis. John Wright NIST Fluid Metrology Group 16th FLOMEKO September 25, 2013 Paris, France. In a comparison, environmental T sensitivity looks like lab-to-lab differences. ~ 50 ppm / K. Motivation. If Lab A tests at room T = 23 ºC

E N D
Thermal Effects on Critical Flow Venturis John Wright NIST Fluid Metrology Group 16th FLOMEKO September 25, 2013 Paris, France
In a comparison, environmental T sensitivity looks like lab-to-lab differences ~ 50 ppm / K Motivation If Lab A tests at room T = 23 ºC and Lab B tests at Room T = 28 ºC? we can expect a ΔCd in a 0.4 mm CFV of 0.025% We work at 23.5 ± 1ºC, but what about our customers?
Sources of T Sensitivity • 4) Sensitivity of reference sensors to room T, e.g. mass flow, pressure • Room T = 297.3 ± 0.5 K • 34 and 677 L PVTt in T controlled water bath at 296.7 K • 3) Thermal expansion of the throat area • 2a= 34 x 10-6 / K, for SS andCu-Te alloy 145 • Significant for large CFVs, less so for small CFVs • d = 30 mm, Jones, Material Temperature Profiles in a Critical Flow Nozzle, ASME, 1983 • d = 25 mm, Caron, Kegel, and Britton, 1995, 1996 • 2) Thermal boundary layer effects: heat transfer from CFV body to gas reduces gas density and mass flux at the CFV throat • 1) Temperature “sampling errors” (spatial non-uniformity, stem conduction, time response) • Goal: quantify and correct temperature sensitivity
Copper (Cu) CFV Design Four CFV d’s: 3.15, 1.09, 0.648, 0.356 mm
Experimental Arrangement #1(to assess T sampling for typical (ISO/ASME) set up) Tup3 Tup2 Tup1 TCFVbody Tz (“hot wire” T sensor) Ceramic pipe liner Cu CFV Water pump Heater controller RTD Bead thermister (TCFVbody) Water to gas heat exchanger
Cd Measurements • 200, 300, 400, 500, 600, and 700 kPa • 3 PVTt collections at each pressure • On 2 occasions, average of 6 points • U(Cd) = 0.06 %
Spatial Temperature Variations (d = 3.15 mm, no CFV heating) TCFVbody Tup1 Tup3 Tup2 Tz
d= 3.15 mm, no CFV heating TCFVbody Tup1 Tup3 Tup2 Tz 0.05 % Tup3 is cold due to conduction from CFV body through approach pipe wall
d= 3.15 mm, TCFV body = 313 K Add a PID controlled heater to CFV: 298, 303, 308, 313 K Tz TCFVbody Tup1 Tup3 Tup2
d= 3.15 mm, TCFV body = 313 K TCFVbody Tup1 Tup3 Tup2 Tz 0.39 % Tup3 is hot due to conduction from CFV body through approach pipe wall
Experimental Arrangement #2(to minimize T sampling uncertainties) Water pump Optional heater Water to gas heat exchanger Optional room T water jacket
d= 3.15 mm, TCFV body = 313 K TCFVbody Tup1 Tup3 Tup2 Tz Add a 297 K water bath to the approach pipe 0.01 % All 4 T sensors give the same Cd values within 0.01 %
Numerous Heat Transfer Mechanisms T sensor Internal flow Inlet gas CFV body Approach pipe wall Room Measured T0 is subject to sampling errors due to heat transfer within the flow, CFV body, and approach pipe walls
What is the temperature distribution in the gas and CFV body? Assume 1-D, isentropic, adiabatic flow through a ISO toroidal copper CFV, 2.2 cm body radius, Bartz 1965 convective heat transfer coefficient, no axial direction heat transfer… d = 3.15 mm TCFVext TCFVint Tadiabatic wall d = 0.36 mm Tcore
T Distribution in CFV Body By using high thermal conductivity CFV material, TCFV body is close to inner wall T (Note that low thermal conductivity material is desirable for non-research applications!) Kegel and Caron, ASME Fluids Engineering Summer Meeting, San Diego, California, USA, 1996.
CT Measurements 298 K 303 K • Four Cu CFVs: d = 3.15, 1.09, 0.65, and 0.36 mm • Use analytical Cd values and TCFV body= 298 K data to determine d • PID control of TCFV body= 298, 303, 308, and 313 K • Apply 2aDT thermal expansion corrections (Tref = 298 K) and plot differences in Cd relative to values at 298 K • Assume CT = 1 - DCd (because other known effects have been corrected) 308 K 313 K 298 K 303 K 308 K 313 K
There is a velocity boundary layer AND a thermal boundary layer • CFV theoretical mass flow equation assumes adiabatic wall (no heat transfer from CFV body to gas) • In reality, a thermal boundary layer is present The warmer, lower density layer near wall leads to lower flow than adiabatic assumption Bejan, Heat Transfer, 1993 Johnson, A. N., 2000
A Correction for the Laminar Thermal Boundary Layer • Choose a reference TCFV body (298 K) • Assume CT = 1 - DCd (because other known effects have been corrected) • As for Cvbl, CT scales with Re-1/2 • CTis proportional to the density change in the thermal boundary layer relative to some reference condition, i.e. proportional to (Tref-TCFV body) / Tref 298 K 303 K 308 K K = empirical constant 313 K
A Correction for the Laminar Thermal Boundary Layer Laminar to turbulent boundary layer transition leads to a Reynolds number offset (Re0)
In prior studies: Bignell, N. and Choi, Y. M., Thermal Effects in Small Sonic Nozzles, Flow Meas. Instrum., 13, pp. 17 – 22, 2002 2.04 mm 1.38 mm 1.0 mm 0.715 mm
Because of CFV body cooling, when we perform a “Room T” calibration, we are following an arc in the CT plane… 288 K ? 293 K ? 298 K 303 K 308 K 313 K
Conclusions • In small CFVs (< 10 mm?), temperature sampling errors and thermal boundary layers lead to significant temperature sensitivity (50 to 300 ppm/K) • Making thermal expansion corrections in small CFVs makes the temperature sensitivity worse! • There are complex heat transfer mechanisms and significant temperature gradients in CFV installations • Better designs of approach pipe, T sensors, sensor placement, and CFV materials will reduce CFV calibration reproducibility and sensitivity to room T • A simple physical model for the thermal boundary layer matches experimental CT values, i.e. corrections are possible