Download
1 / 30
310 likes | 398 Vues
Surface Applications. Fitting Manifold Surfaces To 3D Point Clouds, Cindy Grimm, David Laidlaw and Joseph Crisco. Journal of Biomechanical Engineering, 2002 Parameterization using Manifolds, Cindy Grimm. International Journal of Shape Modeling, 10(1): 51-80, 2004

E N D
Surface Applications Fitting Manifold Surfaces To 3D Point Clouds, Cindy Grimm, David Laidlaw and Joseph Crisco. Journal of Biomechanical Engineering, 2002 Parameterization using Manifolds, Cindy Grimm. International Journal of Shape Modeling, 10(1): 51-80, 2004 Spherical Manifolds for Adaptive Resolution Surface Modeling, Cindy Grimm. In "Graphite", pages 161-168, 2005 WUCSE-2006-29: Smooth Surface Reconstruction using Charts for Medical Data, Cindy Grimm and Tao Ju. Technical Report 2006-29, Washington University in St. Louis, 2006 Feature Detection Using Curvature Maps and the Min-Cut/Max-Flow Algorithm, Timothy Gatzke and Cindy Grimm. In "Geometric Modeling and processing", 2006
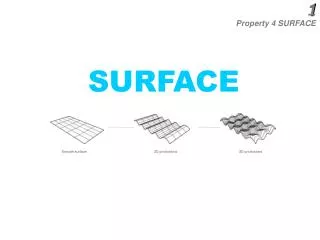
Surface operations supported by manifolds • Hierarchical modeling • Add charts anywhere • Surface reconstruction • Continuity guaranteed • Known topology • Capturing shape variation • Consistent parameterization • Different embedding, same manifold • Multiple parameterizations • Color, geometry, electrical… Siggraph 2006, 7/31/2006 www.cs.wustl.edu/~cmg/
Manifold representation goals • Add charts anywhere, at any scale/orientation • Not restricted to an initial set of charts • Adjust parameterization • “Slide” charts around, change scale/orientation • Re-use parameterization when fitting new geometry • Embedding free to change • Change data samples • Create new parameterization over existing one • In correspondence with original Siggraph 2006, 7/31/2006 www.cs.wustl.edu/~cmg/
Surface types, R2 in Rn • Plane • Sphere • Torus • N-holed torus • Other surfaces with boundary • Cut holes Siggraph 2006, 7/31/2006 www.cs.wustl.edu/~cmg/
Canonical manifolds • Small number of possible types (3 closed) • Define a “canonical” manifold for each • Support equivalent of affine transformations • Points, lines, triangles, barycentric coordinates • Define a procedure for making charts • C∞ • Position plus shape control Siggraph 2006, 7/31/2006 www.cs.wustl.edu/~cmg/
Sphere example • Manifold: Unit sphere, x2 + y2 + z2 = 1 • Representing geometry on the sphere • Mesh on the sphere • Making charts • Embedding the sphere • Blend and embed functions on each chart • Hierarchical modeling • Over-riding existing charts • Surface fitting • Assigning charts • Multiple parameterizations Siggraph 2006, 7/31/2006 www.cs.wustl.edu/~cmg/
Operations on the unit sphere • How to represent points, lines and triangles on a sphere? • Point is (x,y,z) • Given two points p, q, what is (1-t) p + t q? • Solution: Gnomonic projection • Project back onto sphere • Valid in ½ hemisphere • Line segments (arcs) • Barycentric coordinates in spherical triangles • Interpolate in triangle, project All points such that… (1-t)p + tq q p Siggraph 2006, 7/31/2006 www.cs.wustl.edu/~cmg/
Mesh on sphere • Place vertices on sphere • Project edges, faces, onto sphere by taking ray through point • Use mid-point barycentric coords for > 3 sides • Valid for faces < ½ hemisphere Siggraph 2006, 7/31/2006 www.cs.wustl.edu/~cmg/
-1 c Chart on a sphere • Chart specification: • Center and radius on sphere Uc • Range c = unit disk • Simplest form for ac • Project from sphere to plane • (stereographic) • Adjust with projective map • Affine Uc 1 Siggraph 2006, 7/31/2006 www.cs.wustl.edu/~cmg/
Defining an atlas • Define overlaps computationally • Point in chart: evaluate ac • Coverage on sphere (Uc domain of chart) • Define in reverse as ac-1=MD-1(MW-1(D)) • D becomes ellipse after warp, ellipsoidal on sphere • Can bound with cone normal Siggraph 2006, 7/31/2006 www.cs.wustl.edu/~cmg/
Embedding the manifold • Write embed function per chart (polynomial) • Write blend function per chart (B-spline basis function) • k derivatives must go to zero by boundary of chart • Guaranteeing continuity • Normalize to get partition of unity Normalized blend function Proto blend function Siggraph 2006, 7/31/2006 www.cs.wustl.edu/~cmg/
Surface editing • User sketches shape (sketch mesh) • Create charts • Embed mesh on sphere • One chart for each vertex, edge, and face • Determine geometry for each chart (locally) Siggraph 2006, 7/31/2006 www.cs.wustl.edu/~cmg/
Charts • Optimization • Cover corresponding element on sphere • Don’t extend over non-neighboring elements • Projection center: center of element • Map neighboring elements via projection • Solve for affine map • Face: big as possible, inside polygon • Use square domain, projective transform for 4-sided Face Face charts Siggraph 2006, 7/31/2006 www.cs.wustl.edu/~cmg/
Edge and vertex • Edge: cover edge, extend to mid-point of adjacent faces • Vertex: Cover adjacent edge mid points, face centers Vertex charts Edge Edge charts Vertex Siggraph 2006, 7/31/2006 www.cs.wustl.edu/~cmg/
Defining geometry • Fit to original mesh (?) • 1-1 correspondence between surface and sphere • Run subdivision on sketch mesh embedded on sphere (no geometry smoothing) • Fit each chart embedding to subdivision surface • Least-squares Ax = b Siggraph 2006, 7/31/2006 www.cs.wustl.edu/~cmg/
Result • CK analytic surface approximating subdivision surface • Real time editing • Other closed topologies • Define manifold and domain to R2 map Siggraph 2006, 7/31/2006 www.cs.wustl.edu/~cmg/
Torus, associated edges • Cut torus open to make a square • Two loops (yellow one around, grey one through) • Each loop is 2 edges on square • Glue edges together • Loops meet at a point • Chart map: affine transform Siggraph 2006, 7/31/2006 www.cs.wustl.edu/~cmg/
b a a b d c c d N-Holed tori • Similar to torus – cut open to make a 4N-sided polygon • Two loops per hole (one around, one through) • Glue two polygon edges to make loop • Loops meet at a point • Polygon vertices glue to same point Front Back Siggraph 2006, 7/31/2006 www.cs.wustl.edu/~cmg/
Hyperbolic geometry • Why is my polygon that funny shape? • Need corners of polygon to each have 2p / 4N degrees (so they fill circle when glued together) • Tile hyperbolic disk with 4N-sided polygons • Chart map: Linear Fractional Transform Siggraph 2006, 7/31/2006 www.cs.wustl.edu/~cmg/
Hierarchical editing • Override surface in an area • Add arms, legs • User draws on surface • Smooth blend • No geometry constraints Siggraph 2006, 7/31/2006 www.cs.wustl.edu/~cmg/
Adding more charts • User draws new subdivision mesh on surface • Only in edit area • Simultaneously specifies region on sphere • Add charts as before • Problem: need to mask out old surface Siggraph 2006, 7/31/2006 www.cs.wustl.edu/~cmg/
Masking function • Alter blend functions of current surface • Zero inside of patch region • Alter blend functions of new chart functions • Zero outside of blend area • Define mask function h on sphere, • Set to one in blend region, zero outside 1 1 0 0 Siggraph 2006, 7/31/2006 www.cs.wustl.edu/~cmg/
Defining mask function • Map region of interest to plane • Same as chart mapping • Define polygon P from user sketch in chart • Define falloff function f(d) -> [0,1] • d is min distance to polygon • Implicit surface • Note: Can do disjoint regions • Mask blend functions 0 1 d Siggraph 2006, 7/31/2006 www.cs.wustl.edu/~cmg/
Patches all the way down • Can define mask functions at multiple levels • Charts at level i are masked by all j>i mask functions • Charts at level i zeroed outside of mask region Siggraph 2006, 7/31/2006 www.cs.wustl.edu/~cmg/
Results Siggraph 2006, 7/31/2006 www.cs.wustl.edu/~cmg/
Surface fitting • Embed data set on sphere • Any spherical parameterization • Group data points (overlapping) • One chart per group • Chart centered on group, covers • Fit chart embeddings to data points Siggraph 2006, 7/31/2006 www.cs.wustl.edu/~cmg/
Consistent parameterization • Identify features in data • Align features on sphere • Build one set of charts • Embed • Fit each data set Siggraph 2006, 7/31/2006 www.cs.wustl.edu/~cmg/
Consistent parameterization • Build manifold once • Fit to multiple bone point data sets • Parameterized similarly Siggraph 2006, 7/31/2006 www.cs.wustl.edu/~cmg/
Multiple parameterizations • Build atlas for each case • Atlas does not need to cover sphere • Can be C0 Simulation Geometry Texture mapping Siggraph 2006, 7/31/2006 www.cs.wustl.edu/~cmg/
Benefits of canonical approach • Global manifold • Link different embeddings, atlases • Easy to adjust charts • Charts independent from source data • Layered charts (different atlases) • Masking, boundaries, creases • No special cases • Not polynomial • Computationally more expensive • Topology-dependent algorithms Siggraph 2006, 7/31/2006 www.cs.wustl.edu/~cmg/