Download
1 / 47
470 likes | 561 Vues
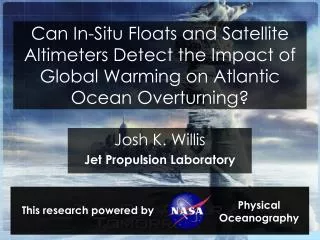
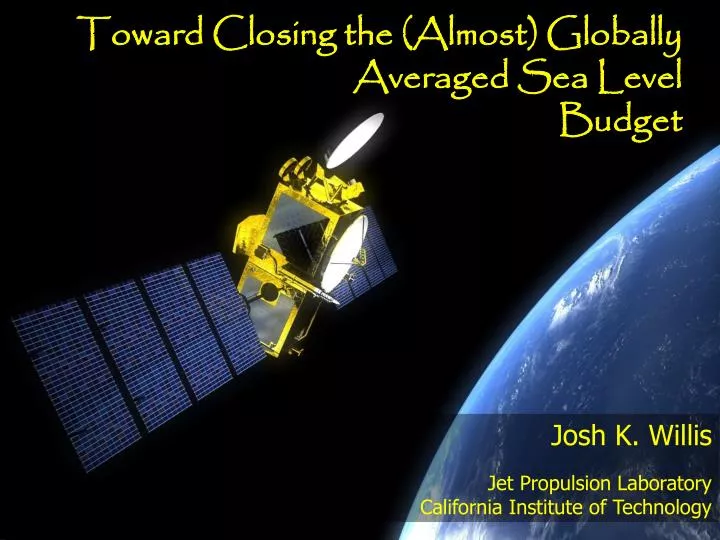
Toward Closing the (Almost) Globally Averaged Sea Level Budget. Josh K. Willis Jet Propulsion Laboratory California Institute of Technology. Thanks to Don Chambers, Steve Nerem Al Gore John Lyman, Greg Johnson, John Gilson Rush Limbaugh

E N D
Toward Closing the (Almost) Globally Averaged Sea Level Budget Josh K. Willis Jet Propulsion Laboratory California Institute of Technology
Thanks to Don Chambers, Steve Nerem Al Gore John Lyman, Greg Johnson, John Gilson Rush Limbaugh Susan Wijffels, Catia Domingues, Paul Barker, Neil White, Ann Gronell, Ken Ridgway, John Church
Overview • Motivation (as if you needed any) • In case you haven’t heard: Oceans not cooling! • 2003 – 2007 Sea Level Budget • Revised Thermal Expansion ’93 – ’07
“Globally-Averaged” Sea Level Rise • About 20 cm of SLR over the record • Obvious acceleration From Church and White,GRL, 2005
addition of heat addition of freshwater Gobally-averaged sea level rise Total sea level rise + = (roughly)
Earth Warms Earth’s Energy Balance Balance is restored Atmosphere Atmosphere
Ocean Warming ≈ Global Warming from Levitus et al., GRL, 2005
Earth Warms Earth’s Energy Balance To raise Earth’s temperature The Oceans must warm
“Recent Ocean Cooling” ~ 6 mm drop in thermosteric sea level From Lyman et al., GRL, 2006
My brush with Rush “Proving again, that they really don’t know much about anything when it comes to climate, climate change and so forth.” ̶ Rush Limbaugh “To overturn the world economy based on the musings of a few idiot leftist scientists is just stupid, and that’s what Global Warming is all about.” ̶ Rush Limbaugh
In Situ Data biases: Argo floats SOLO/FSI floats have a cold bias at depth
A correction to “recent cooling” Ocean Heat Content from 2004 to 2006 Removing the bad float data reduces the cooling but does not completely eliminate it. From Willis et al., JTECH, in press
Isotherm Displacement: Dz = Tclim – T dTclim /dz In situ data biases: XBT fall-rate errors Comparison of Isotherm Displacements XBT/Argo pairs ~12,000 Argo/CTD pairs ~2,000 From Willis et al., JTECH, in press
A correction to “recent cooling” Ocean Heat Content from 2004 to 2006 Another bias: XBTs are biased warm, which also causes spurious cooling. From Willis et al., JTECH, in press
Time Varying Bias Shallow probes Deep probes Common time history by profile type suggests manufacturing changes cause time varying bias From Wijffels et al., JCLIM, in press
Revised upper ocean warming From Domingues et al., Nature, 2008
Mountain Glaciers (Duygerov & Meier, 2005) Greenland & Antarctica (IPCC, AR4, 2007) 0/700 m warming Deep Warming (Köhl et al., JPO, 2007) Terrestrial Storage (Ngo-Duc et al., GRL, 2005) Sum of components Tide gauge reconstruction The 40-year Sea Level Budget From Domingues et al., Nature, 2008
Toward closing the globally averaged sea level budget on seasonal to interannual time scales Josh K. Willis joshua.k.willis@jpl.nasa.gov Jet Propulsion Laboratory Co-Authors: Don P. Chambers, R. Steven Nerem From Willis et al., JGR – Oceans, 2008
addition of heat addition of freshwater Globally-averaged sea level rise Total sea level rise + = (roughly) Argo GRACE Jason
Argo • Argo data only • All data with known pressures errors removed. • Steric height computed from Argo Temp. & Sal. • Monthly objective maps of large scale steric variability.
Argo data distribution Mid 2003 is data sparse in Southern Hemisphere 1800 km zonal, 700 km meridional e-folding scale
Test of Mapping Procedure • Jason data interpolated to time and location of Argo profiles • Mapped using same mapping procedures • Compared with full Jason time series RMS difference: 1.6 mm
Atmospheric and Ocean models • Adjustment for incompressibility • Degree 2, order 0 coefficients from SLR • Monthly model of geocenter+ • GIA correction* • Land mask • ± 66° latitude ± 0.2 mm/yr ± 0.2 mm/yr + Swenson et al., JGR-Oceans, submitted. * Paulson et al., Geophys. J. Int., 2007
Mass exchange with high latitudes Difference between total ocean average and ± 66° average Very small interannual signal
Jason • Jason data only • Standard corrections applied (including IB) • GIA +0.3 mm/yr [Douglas and Peltier, 2002]
The recent sea level budget Global Mean Sea Level Global MSL, no seasonal Total (Jason) Total (Jason) Steric (Argo) Steric (Argo) Mass (GRACE) Mass (GRACE)
Sea Level Budget Seasonal cycles agree to within random error 4-year trends have discrepancy larger than random error => systematic error remains!
The recent sea level budget Total (Jason) Global MSL, no seasonal cycle, no trend Removal of trend brings all three estimates into excellent agreement Steric (Argo) Mass (GRACE) RMS difference: 1.6 mm
4-year Trends in sea level The recent sea level budget Jason General agreement is encouraging Jason-GRACE But, difference in S. Hemisphere trends is concerning Argo
Correcting the 15 year record of thermosteric sea level rise
“Pseudo-pair” comparison Comparison of Sippican Deep Blue probes with nearby Argo pairs (2004 – 2006), ~12,000 • Pseudo-pairs give same bias, but have narrower distribution • More comprehensive means of test XBT bias because of SSH data availability From Wijffels et al., JCLIM, in press.
Stretching factor by probe type From Wijffels et al., J CLIMATE, in press
Revised thermosteric sea level 3.2 mm/year Equivalent to 0.55 W/m2 of radiative imbalance 1.4 mm/year
Inferred estimate of mass increase Discrepancy with GRACE remains 1.9 mm/year 1.6 mm/year Slight differences in total SSH
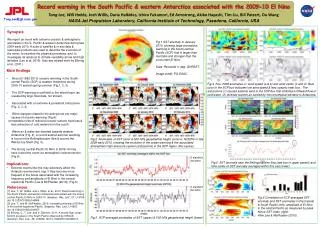
PDF Interannual variations in SSH 1-Year average of SSH during the 1997-98 El Niño Variations are O(10 cm)
14 year trend in SSH from AVISO Global mean: 3.0 mm/yr
14-year trend in thermosteric sea level Combined in situ + altimeter mean: 1.4 mm/yr In situ data only mean: 1.4 mm/yr
14-year trend in total minus thermosteric Combined in situ + altimeter mean: 1.6 mm/yr In situ data only mean: 1.6 mm/yr
14 year trend in globally averaged temperature Warming Signal is O(0.15°C) = 5-10 m in depth
The Ocean Observing System Profile distribution for 1993 Profile distribution for 2007
The Ocean Observing System No Plan for Measuring the Deep Oceans!
1999-1985 Hydrographic surveys From Fukasawa et al., Nature, 2004
Hydrographic surveys 2006-1984 2006-1991 1991-1984 From Johnson et al., Journal of Climate, 2007
Conclusions • No more ocean cooling! • GRACE, Jason & Argo still do not agree • Revised thermal expansion: ’93 – ’07: 1.4 mm/yr => 1.6 to 1.9 mm/yr mass • Deep Ocean Warming remains unmeasured