Download
1 / 13
130 likes | 238 Vues
Decadal variability in the Indo-Pacific ocean inferred from satellite data and ECCO assimilation. Tong Lee NASA Jet Propulsion Laboratory, California Institute of Technology Michael McPhaden NOAA Pacific Marine and Environmental Laboratory.

E N D
Decadal variability in the Indo-Pacific ocean inferred from satellite data and ECCO assimilation Tong Lee NASA Jet Propulsion Laboratory, California Institute of Technology Michael McPhaden NOAA Pacific Marine and Environmental Laboratory Reference for observational part: Lee and McPhaden (2008), GRL, Jan. 15 issue
Motivation Linkages of DecVar of ocean circulation in the Indo-Pacific region not well understood, e.g., the meridional overturning circulations (MOCs) of the two oceans were studied separately (McPhaden & Zhang 2002/2004, Lee 2004). Approach • Analyze satellite observations of sea surface height (SSH) and ocean surface wind in the past 15 years; infer ocean circulation changes. • SSH: TOPEX/Poseidon (1992-2005) & JASON-1 (2001-present) altimeters; • Wind: ERS (1991-2001) & QuikSCAT (1999-present) scatterometers. • Quantify ocean circulation changes using ECCO (http://www.ecco-group.org) & ECCO-2 (http://ecco2-org, hi-res) ODA products.
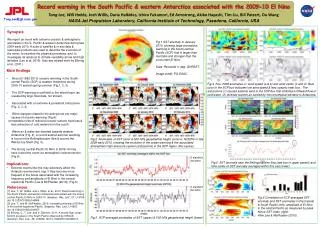
Decadal tendencies change sign around yr 2000. SSH in many regions forced by near-local wind (tilted arrows reflect ocean adjustment by Rossby waves) cm/yr SSH trend for 1993-2000 (T/P altimeter) dyn/cm2/yr Wind stress curl trend for 1993-2000 (ERS scat) SSH trend for 2000-2006 (T/P,Jason-1 altimeters) Wind stress curl trend for 2000-2006 (QuikSCAT)
SSH time series (black curves) in key regions further illustrate the tendency change around 2000 • Tropical Pacific leads other regions. • The role of ENSO residuals on decadal time scales?
. Pacific Ocean Indian Ocean Trade wind Southeasterly trade wind 10S 10N Westerly wind N 30S 20S 10S 0N Ekman flow Ekman flow Ekman flow 50 m Subtropical cell Equatorward thermocline flow Equatorward thermocline flow Cross-equatorial cell thermocline flow 500 m Bird’s eye view Divergence of Ekman flow Convergence of w. boundary & interior pycnocline flow Pycnocline inflow Ekman outflow Schematics for zonally averaged view and horizontal view of time-mean Pacific & Indian-Ocean shallow MOCs
Implications of observed decadal wind & SSH to MOCs Anomalous Ekman Weaker tradewind Stronger tradewind Anomalous Ekman Stronger tradewind Weaker tradewind Decadal change of zonal wind ~ meridional Ekman flow (upper branch of MOC): reflect atmospheric bridge (anomalous Walker Circulation). Decadal change of E-W SSH difference ~ thermocline flow (lower branch of MOC): reflect oceanic linkage (wave-transmission from NW Pacific to SE Indian Oceans) Anomalous pycnocline flow Anomalous pycnocline flow
Volume (left) & temperature (right) fluxes of the Indonesian throughflow estimated by ECCO products
Observed decadal change of Indian-Ocean trade wind & MOC strength estimated by ECCO assimilation Trade wind Estimated MOC
Comparison of SSH trend for 1993-2000 (indicative of DecVar): large-scale similarity Altimeter data ECCO-JPL estimate Used to estimate gyre circulation changes
Barotropic streamfunction: mean (left) & decadal change (lower) Mean Weakening Western Subarctic Gyre Strengthening North Central Pacific Gyre Decadal change Strengthening Kuroshio recirculation gyre Strengthening South Pacific Subtropical Gyre
Summary • Near-coherent decadal tendency changes SSH & wind in the Indo-Pacific region at the end of the 20th century: broader than PDO. • Equatorial Pacific SSH, forced by local trade wind, leads the changes. • Anti-correlated changes of MOCs in the Pacific & Indian Oceans, thus opposite roles in regulating tropical heat content: atmospheric connection via Walker circulation & oceanic linkage by ITF. • Coherent variations of subtropical & subpolar gyres: atmospheric tele-connections.
Decadal signals from Reynolds SST PDO index Nino3.4 index
NINO3 3.4 index PDO index SSH time series (black curves) in key regions further illustrate the tendency change around 2000 • Tropical Pacific leads other regions. • The role of ENSO residuals on decadal time scales?