Download
1 / 10
100 likes | 296 Vues
ECCO-2 and NASA Satellite Missions Lee-Lueng Fu Jet Propulsion Laboratory January 22-23, ECCO-2 Meeting. A snapshot of sea surface height anomalies from T/P and ERS altimeters. Spatial scales of the AVISO T/P-ERS merged data. Overlapping at 150 km. T/P along-track. T/P-ERS mapped.

E N D
ECCO-2 and NASA Satellite Missions Lee-Lueng Fu Jet Propulsion Laboratory January 22-23, ECCO-2 Meeting
A snapshot of sea surface height anomalies from T/P and ERS altimeters
Spatial scales of the AVISO T/P-ERS merged data Overlapping at 150 km T/P along-track T/P-ERS mapped T/P mapped SSH wavenumber spectra (Ducet et al. 2000)
Small-scale Variability of the Ocean Unresolved by Nadir-looking Altimeter ground tracks of Jason (thick) and T/P (thin) Tandem Mission 10 km scale eddies Resolvable by HM 100 km scale eddies resolvable by WSOA 100 km
Coastal currents have scales less than 10 km 42.5º N h ~ 5 cm v ~ 50 cm/sec < 10 km < 10 km 41.9º N < 10 km Observations made by ADCP offshore from the US West Coast T. Strub
Sub-mesoscale variability Radius of deformation Radius of deformation Sub-mesoscale processes are poorly observed but important to the understanding of the dissipation mechanism of ocean circulation. McWilliams (2006)
Altimetry SSH wavenumber spectrum T/P Jason pass 132 (147 cycle average) ? Power density (cm2/cycles/km) Noise level of HM for 2 cm measurement noise at 2 km resolution T/P ? Wavenumber (cycles/km) Much reduced noise floor will enable the study of the spectrum at sub-mesoscales which have not been well resolved from existing data. Stammer (1997)
Geostrophic velocity error spectrum 100 50 25 km k -2 spectrum = 2cm/7km = 2cm/2km (or 1 cm/7km) Velocity error (cm/s)2/cyc/km = 1cm/km (or 0.4 cm/7km) Wavenumber (cyc/km) For the three cases, velocity error is reduced from 7.8 to 3.6, 1.3 cm/sec at 25 km resolution; or 27, 15, 5 cm/sec at 10 km resolution
8 7 6 5 4 3 2 1 Number of Observation A Global Hydrosphere Mapper A SAR interferometry radar altimeter Near-global coverage with 16-day repeat orbit • Same technique as WSOA – radar interferometry • Use of SAR to enhance the along-track resolution • 2 cm measurement precision at 2 km resolution • 1 micro-radian precision in mean sea surface slope at 2 km resolution • No data gap near the coast
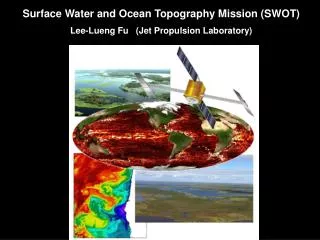
Wide swath altimetry has been proposed as a surface water and ocean topography (SWOT) mission and favorably endorsed by the NRC Decadal Survey for a possible new mission in the time frame of 2013-2016.