Download

1 / 16
180 likes | 545 Vues
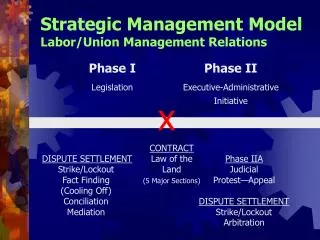
Labor Union Ideas. Intro. You and I have seen that firms that want to hire labor take a good look at the marginal revenue product of labor and consider this MRP as the basis of the demand for labor.

E N D
Intro You and I have seen that firms that want to hire labor take a good look at the marginal revenue product of labor and consider this MRP as the basis of the demand for labor. People supply labor and what they look at are their options. Folks like to do lots of things. When the wage rises they may give up these things and work (remember income and substitution effect we saw before). Let’s think about reality – workers like wages to be high and firms like them to be low. This tension is settled as the firms and workers interact. We turn to various forms of interaction here.
Perfectly Competitive Labor Market W In a competitive market with lots of buyers and lots of sellers and no one of them being a large part of the market means that the “force” of supply and demand will mean the wage and quantity traded will occur where the supply and demand cross Wc and Lc in the graph. The logic here is this – if some participants want the wage to be higher the amount S1 Wc D1 L Lc supplied will be greater than the amount demanded and thus those not hired will offer to work for less pushing the wage down to Wc. If some want the wage to be lower than Wc, firms will not get enough workers and will thus offer higher wages up to Wc.
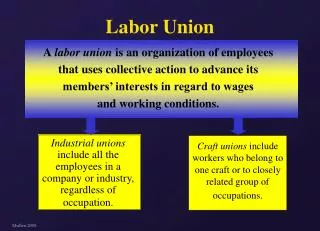
Unions In the book you see that unions can be craft or industrial. The impact each has on the market is essentially the same, but brought about in a different manner. A craft union tries to restrict the supply of labor to be less than what occurs naturally. The book shows a vertical supply, although it could be upward sloping, but to the left of what we see in figure 9.1. The impact is to have a higher wage and less labor employed than what would happen with a competitive market. Because of this there is a deadweight loss. Remember the deadweight loss is an indication that some units are not being traded even when the demanders have value above what suppliers need to get. Overall, society loses. Note the union does it because overall it is good for the union and its members.
Unions An industrial union just attempts to get a union wage set above the market equilibrium. If this happens, as we see in figure 9.2, then the wage is pushed up, but demanders of labor reduce the quantity they want and thus the amount traded is less than what would happen in a competitive labor market. The same type of deadweight loss as before occurs. Now, unions have improved working conditions and made other gains for workers that have been positive. But, from the wage and employment point of view we go with these models presented thus far.
Numerical example units of labor TP MP Product Price TR MRP 0 0 --- $2 0 ---- 1 17 17 2 34 34 2 31 14 2 62 28 3 43 12 2 86 24 4 53 10 2 106 20 5 60 7 2 120 14 6 65 5 2 130 10 In this example of one firm we see the labor units added to a fixed base of other resources and we see the total quantity made, TP (total product), go up, but at a diminishing rate (marginal product numbers getting smaller). If the output can be sold at $2 per unit then we have the total revenue, TR, column as shown and we have the marginal revenue product column.
Numerical example If in the competitive market the wage is $14 then the firm shown would want 5 units of labor (have this quantity demanded) because all 5 units have MRP at least as great as the wage (what might be called the marginal resource cost). For this firm the competitive price leads to 5 units of labor taken. A monopsony is a situation where you have a single buyer of labor. As the only buyer then perhaps the firm can have an impact on the market. Basically, the single buyer will try to pay a lower amount than the competitive amount because what else are the sellers going to do? In order to develop this idea let’s turn first to another numerical example.
labor supply example units of labor wage Here we see the first unit of 0 0 labor will not be supplied 1 6 until the wage is $6. The 2 9 2nd unit will be supplied if 3 12 the wage is $9, and so on. 4 15 5 18 6 21 This supply of labor comes from people and their desires to do other things and work like we saw before. But, because of people, this labor supply will mean something to the firm and its total expenditure TE on labor and hence on its marginal expenditure ME on labor.
Monopsony units of labor wage TE ME 0 0 0 0 1 6 6 6 2 9 18 12 3 12 36 18 4 15 60 24 5 18 90 30 6 21 126 36 What we see here is based on the idea that the firm has to pay each unit of labor the same amount. If the firm wants 2 units of labor it has to pay each 9, even though 1 would work for 6. Thus the TE is 18 for 2 workers. Also, on the ME of the second worker is 12 and this is made up of the 9 paid to the second worker and the extra 3 paid to the first worker.
Monopsonies take fewer units and pay lower wage than in competition. Monopsony In figure 9.3 in the book you see the supply line and the ME is above the supply. From the numerical example the units of labor and the wage make up the supply and the units of labor and ME column make up the ME curve. The monopsony compares the ME and the MRP and takes the units where MRP > or = ME, but doesn’t take the units where the MRP < ME. (In the graph go to where MRP = ME). In the numerical example we have the firm wanting to take 3 units and then when you look at the supply curve they can have 3 units at a wage of $12 each. We saw a competitive situation of a wage of 14 and 5 units of labor taken, but in a monopsony we get a lower wage of 12 and a lower amount of labor taken, 3 units.
Bilateral Monopoly A bilateral monopoly is a situation where there is both a single buyer and a single seller. In labor markets the single buyer, the monopsony, is able to lower the wage from the competitive amount. We need to look at the labor union as a single seller of labor. Before you and I saw a single seller is able to charge a higher price than in a competitive setting. So we would expect the wage to be higher there. Let’s first look back at the numerical example of labor supply. I had 1 unit of labor forthcoming if the wage is $6. Another way to think about this is that the laborer didn’t want to give up other things unless they were paid $6. SO the other stuff given up had value of about $6 to the worker. And the second unit of labor needed $9, so the other things given up had a value of about $9.
Bilateral Monopoly The point I want to make here is that as a monopoly seller of labor the union recognizes that the workers are giving something else up to work and this is really a cost. The wage they get makes up for what they give up. The supply curve is really a marginal cost curve. Also, from the unions perspective the firm’s MRP schedule will be used to think of the marginal revenue for the union. If the union negotiated a wage of $34 the firm would only want 1 unit of labor and the total revenue to the union would be $34. But if the union negotiated a wage of $28 the firm would want 2 units of labor and the total revenue would be $56. So, to the union the 2nd worker only has a marginal revenue of 56 minus 34 = 22. The wage of the second worker is 28 but the marginal revenue is 22.
Bilateral Monopoly In figure 9.4 you see the firm MRP and the monopoly union seller of labor uses that to get its MR. The union then wants to go to the point where its MR = MC (supply line). From the numerical examples I have had units of labor MR to union wage (supply or MC) MRP 0 --- --- ---- 1 34 6 34 2 22 9 28 3 16 12 24 4 8 15 20 5 -10 18 14 6 -10 21 10
Bilateral Monopoly Notice on the previous slide that the MR > MC to the monopoly seller of labor on the first 3 units but after that the inequality changes to a <. We never have = exactly. So, the monopoly union wants to get 3 units of labor hired. From the firms MRP we see a wage of 24 would still have the firm hire 3 works. So the union wants a wage of 24 and 3 units hired. IN my example the Monopsony wants wage of 12 and 3 units of labor and the Monopoly union seller wants a wage of 24 and 3 units. The picture in figure 9.4 has different wages, like my example, but the graph has different labor amounts whereas my example has the same labor amount. No problem really.
Bilateral Monopoly What have we accomplished and did we need a somewhat sophisticated model to get there? What we see is that a union would like high wages and a single buyer, like a sports league, would like low wages. The way to resolve the matter is through negotiation and in the process of bargaining each side will try to use any bargaining power it may have. Some dude named Nash (not Steve) said a groups bargaining power stems from its ability to walk away from the bargaining table. A threat point is the value of opportunities that one side has outside the current contractual arrangement. The higher the threat point the greater the bargaining power.
Bargaining Power Unions have the ability to strike (not always, but in sports they can). Their power is enhanced if members are together and if they can withstand a period of lost wages and benefits. The union will also want to see what a work stoppage will do to sales and revenue of owners. The more it would hurt the owners the less power the owners would have. The rest of the chapter is a about the actual history of bargaining in sports. Note table 9.1 is showing history of labor relations in the 4 major pro sports in North America. Table 9.3 has details of current collective bargaining arrangements.