Download
1 / 24
240 likes | 384 Vues
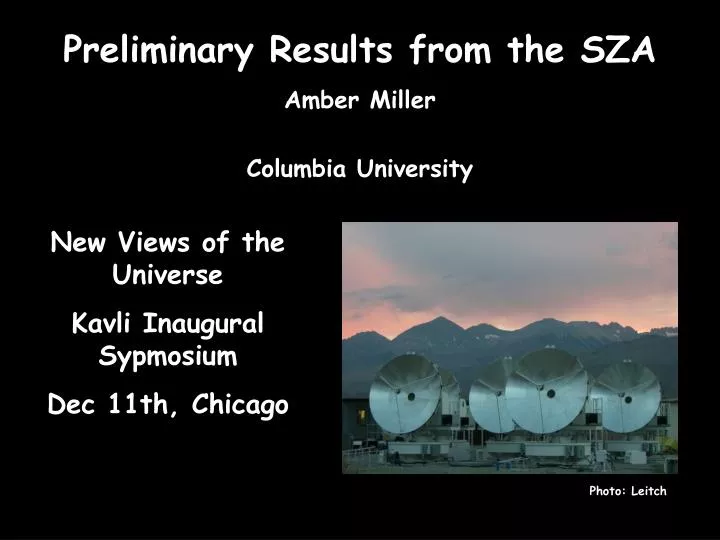
Preliminary Results from the SZA Amber Miller Columbia University. New Views of the Universe Kavli Inaugural Sypmosium Dec 11th, Chicago. Photo: Leitch. The Sunyaev-Zel’dovich Array (SZA).

E N D
Preliminary Results from the SZA Amber Miller Columbia University New Views of the Universe Kavli Inaugural Sypmosium Dec 11th, Chicago Photo: Leitch
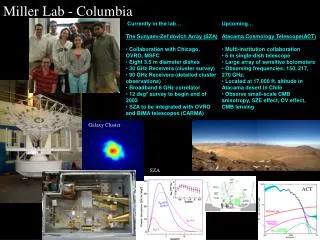
The Sunyaev-Zel’dovich Array (SZA) Chicago:John Carlstrom, Clem Pryke,John Cartwright, Marcus Runyan Ryan Hennessy, Chris Greer, Michael Loh, Matthew Sharp Columbia: Amber Miller, Stephen Muchovej, Tony Mroczkowski, David Tam, Ben Hooberman, Dan Harlow,Jhumki Basu (with Renaissance Charter School Students) Caltech:David Woody, David Hawkins, James Lamb NASA/MSFC:Marshal Joy, Georgia Richards JPL: Erik Leitch Photo: Leitch Funding: NSF-ATI, NSF-KICP, McDonnell Foundation, U. Chicago, Packard Foundation
SZA Essentials • Eight 3.5 m diameter telescopes (30 m RMS surface, 1” pointing) • Close-packed configuration for high surface brightness (1.2 diameter spacings) • 30 GHz Receivers (cluster survey) • 90 GHz Receivers (detailed cluster observations) • Broadband 8 GHz digital correlator (dense sampling in the Fourier plane) • Currently taking science data • SZA to be integrated with OVRO and BIMA telescopes (CARMA) will allow detailed imaging to ~5” Photos: Leitch
SZA 8 GHz, 28 baseline digital correlator(Designed by Dave Hawkins, OVRO)
SZA Telescope Construction – fall ‘03 Forcier Machine Photos: Leitch
SZA Construction/Integration – winter ‘04 Photos: Leitch
SZA Telescope Final Integration fall ‘04 Photos: Leitch
Some Previouly Seen Clusters 1914 Abell 1914 ~1.5 hours of data z=0.17 (~10 sigma detection) Cluster anaysis and images: Muchovej
CL1226 CL1226 6.3 hours of data z=0.84 (~8 sigma detection) 1 point source removed Cluster analysis and images: Muchovej
A2218 Abell 2218 9.3 hours of data z=0.18 (~11 sigma detection) 3 point sources removed Cluster analysis and images: Muchovej
Clusters not seen before in the SZE CL1429 (z=0.92) M~5x10¹⁴ Msun X-ray detection Maughan et al. (and references therein) 2005 SZE detection (SZA) 1 pt source removed ~7 sigma detection 29 hours Cluster analysis and images: Muchovej
Clusters not seen before in the SZE CL1415 (z=1.03) M~3.7x10¹⁴ Msun Maughan et al. (and references therein) 2005 SZE Detection (SZA) 44 hours 1 point source, 1 galaxy, ~5 sigma detection Cluster Analysis and images: Muchovej
A2218 OVRO/BIMA vs SZA 9 hours 50 hours Markov code adapted from OVRO/BIMA team by Mroczkowski Analysis Mroczkowski
Mini mosaic Test - Cl10016 Field Verify Array Performance Verify Survey Sensitivity Verify Analysis Tools pixel value distribution of significance map. Red line is Gaussian with sigma=1 (should match observed if there are no sources in the mosaic) Point source shows up at ~ 50 sigma (results in highly non-Gaussian pixel value distribution). Signal map - peak value is point source flux Significnce map - units of detection sigma Mosaic analysis: M. Loh
Point Source Removed (all 10 fields) Multi-pointing data fit to a point source model (initial location chosen by peak in long baseline map but allowed to float) Beam modeled as truncated Gaussian (reasonable match to real beam) Green + indicates x-ray cluster position SZA cluster shows up at ~17 sigma Note long tail in short baseline pixel value distribution (cluster decrement) Signal map - peak value (negative) is cluster flux Significnce map - units of detection sigma Mosaic analysis: Loh
Main Cluster Removed (all 10 fields) Multi-pointing data fit to a cluster model (visibility amplitude exponential with baseline length, and exp width free). Spectral shape is fixed at that expected for SZE Beam modeled as truncated Gaussian (reasonable match to real beam) Signal map - peak value (negative) is cluster flux Significnce map - units of detection sigma Mosaic analysis: Loh
SZE Blank Field Survey for Cosmological Measurements (dN/dz) First Pass Testing mass limit with mock SZA survey (Pryke) • White, Hernquist, Springel, (WHS) 15 of 1 deg x 1 deg images from hydro sims.
SZA survey (12 square degrees) - in progress • four fields (each roughly three square degrees equally spaced in RA) • expect ~100 clusters (survey designed for sensitivity to clusters and secondary CMB anisotropy) • science requires photometric redshifts (requires imaging in several bands including near IR) • fields need to be selected in order to • be properly spaced in RA to allow survey observations 24 hours/day • be properly positioned in declination (near zenith at transit) so as to minimize atmospheric contamination and to optimize imaging • minimize foregrounds (WMAP Ka band map) • to take advantage of as much publicly available optical data as possible for for redshift information - two fields overlap with existing optical data
Survey Science • Cluster Abundance dN/dz • Determine 8to 5% • Tests of Non-Gaussianity • Spatial power spectrum, P(k) Mohr 2001 Carlstrom, Holder, Reese, 2002, ARAA V40
Survey Science Combining with X-ray observations • Angular Diameter distance/Hubble Constant • gas mass fractions • Scaling Relations Mohr 2001 Massimilliano et al (BIMA/OVRO SZE team), 2005 Ho=77.3 ±4 ±7 km s-1 Mpc-1 (LCDM) fg(x-ray) = 0.109±0.003 fg(SZE) = 0.115±0.005 LaRoque et al 2005, LaRoque PhD thesis
SZA Coverage Secondary CMB Anisotropy Measurements Cl(SZ) (bh)2 (8)7Komatsu & Seljak astro-ph/0205468 CBI (95% C.L.) BIMA (68% C.L.) 10 “blank” fields0.1 sq deg Diffuse SZEsimulations CBI & sims: Bond et al. 2002BIMA: Dawson et al. 2002
Pointed Cluster Observations • SZE + X-ray + optical + cluster simulations comparison of individual objects study how various effects impact cosmological parameter determination • scatter in observables due to projection effects, ellipticity • uncertainty in gas density profile, cluster structure • cluster evolution • cooling cores, cold fronts, shock fronts, evacuated cavities • merger history, current dynamical state, relationship of intra-cluster gas to stellar population • Study proto-cluster candidates Abell 2597: NASA/CXC/Ohio U/B.McNamara et al. Abell 1785: NASA/IoA/AC Fabian et al.
Conclusions • The SZA is up and running, taking science data • Performance has been verified (individual cluster observations, mosaic observations) • 12 deg2 survey currently in progress • The team is analyzing data • Stay tuned for exciting science results coming soon to a neighborhood near you…